Connecting PIDs in DataCite Metadata
/Cite this blog as Habermann, T. (2025). Connecting PIDs in DataCite Metadata, Front Matter. https://doi.org/10.59350/6s7dv-5ds58.
The Winter Meeting of the Earth Science Information Partners (ESIP) occurred on-line during January 2025. A session titled “Enabling Connections among Persistent Identifiers (PIDs)” was organized by Matt Mayernik and included talks by Matt, Madison Langseth (USGS), Shelley Stall (AGU), and I. The recording of the session is available as are my slides.
DataCite RelationTypes
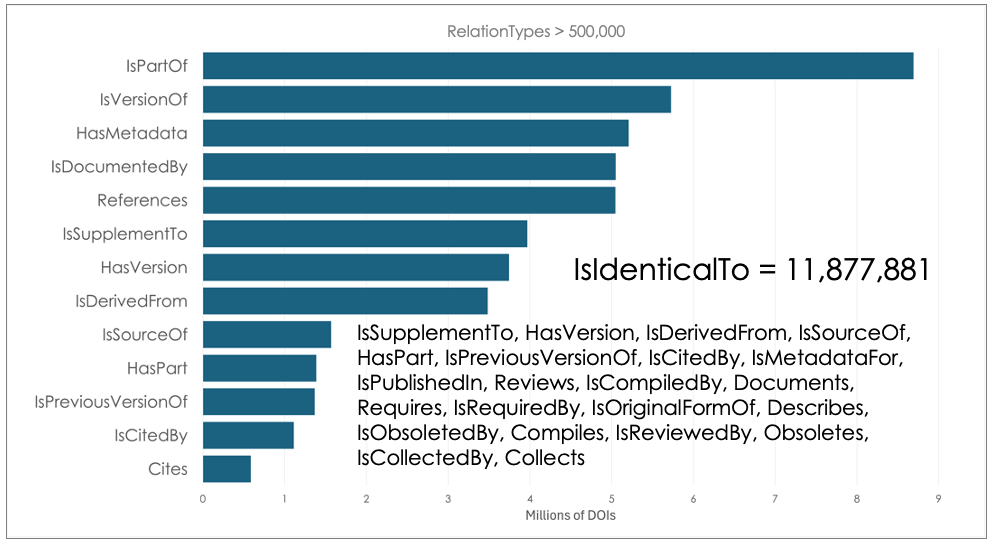
My talk focused on the relationTypes that are included in the DataCite metadata schema for describing relationships between various research objects. Figure 1 shows the number of occurrences of relationTypes that occur over 500,000 times. Others are listed in text in the Figure.
Figure 1. Number of occurrences of relationTypes in DataCite metadata repository. Those with more than 500,000 occurrences are shown. Those with < 500,000 are listed in text.
The most common relationTypes are generally used by a small number of repositories to address specific use cases, described in Table 1.
Table 1
DataCite Metadata Detail
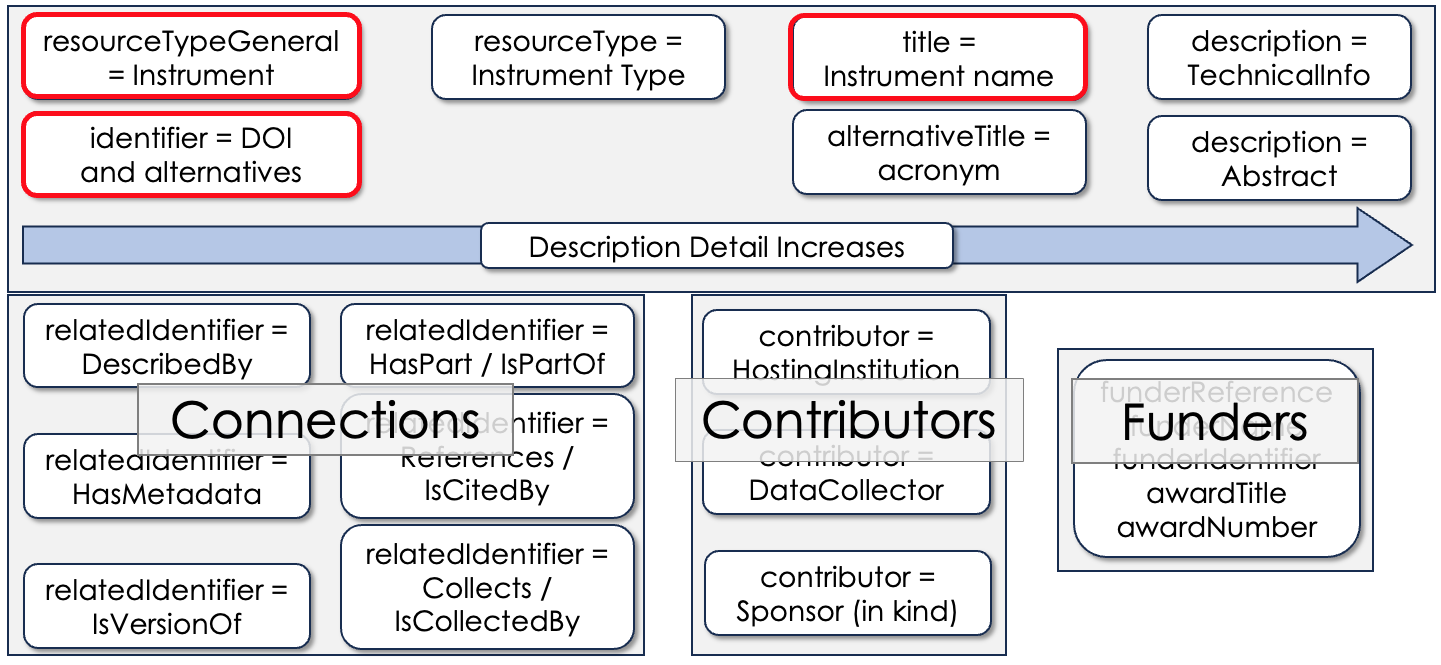
In addition to enabling connections across the global research infrastructure, the DataCite metadata schema includes elements that provide metadata at a variety of levels of detail (Figure 2).
Figure 1. DataCite metadata elements provide a spectrum of detail about datasets and other resources. This example illustrates levels of detail for instrument metadata. Items marked in red are mandatory, all others are recommended or optional.
This case, for instrument metadata, shows how metadata elements can be used to provide multiple levels of detail in instrument descriptions across the top. Multiple kinds of connections are shown across the bottom of the slide: Connections, Contributors, and Funders. The elements shown in red are the mandatory elements which are common to all DataCite metadata. Unfortunately, in many cases, e.g. when someone is trying to get a DOI as soon as possible, these are the only metadata elements included in the DataCite metadata. The other elements shown here therefore provide a generally unused capability for more detail in more complete DataCite metadata.
Measuring Connectivity
Quantitative measures (metrics) of the occurrence of identifiers in metadata are a critical tool for identifying good examples (bright spots), identifying opportunities for improvement, and tracking progress as those improvements are made. One measure specifically designed for identifiers of many kinds is termed Connectivity (Habermann, 2023 and 2024).
Figure 3 shows connectivity for the Southern Cross University DataCite repository for six text fields and identifiers (creatorsID, creatorsAffiliation, creatorsAffiliationID, Funder Name, Funder Identifier, and Award Number). Each bar shows the % of repository DOIs that have all (green), some (yellow), and no (red) occurrences of the text field or identifier. For example, the fifth row shows that 78% of the DOIs have affiliations for all creators, 5% of the DOIs have affiliations for some creators, and 17% of the DOIs have no affiliation metadata. Similarly, the fourth row measures how many repository DOIs have identifiers for those affiliations. The connectivity varies significantly across the six metadata elements, identifying Award Numbers and Creator IDs (ORCIDS) as opportunities for improvement.
Figure 3. Southern Cross University Connectivity for six identifiers. The bars give % of repository DOIs.
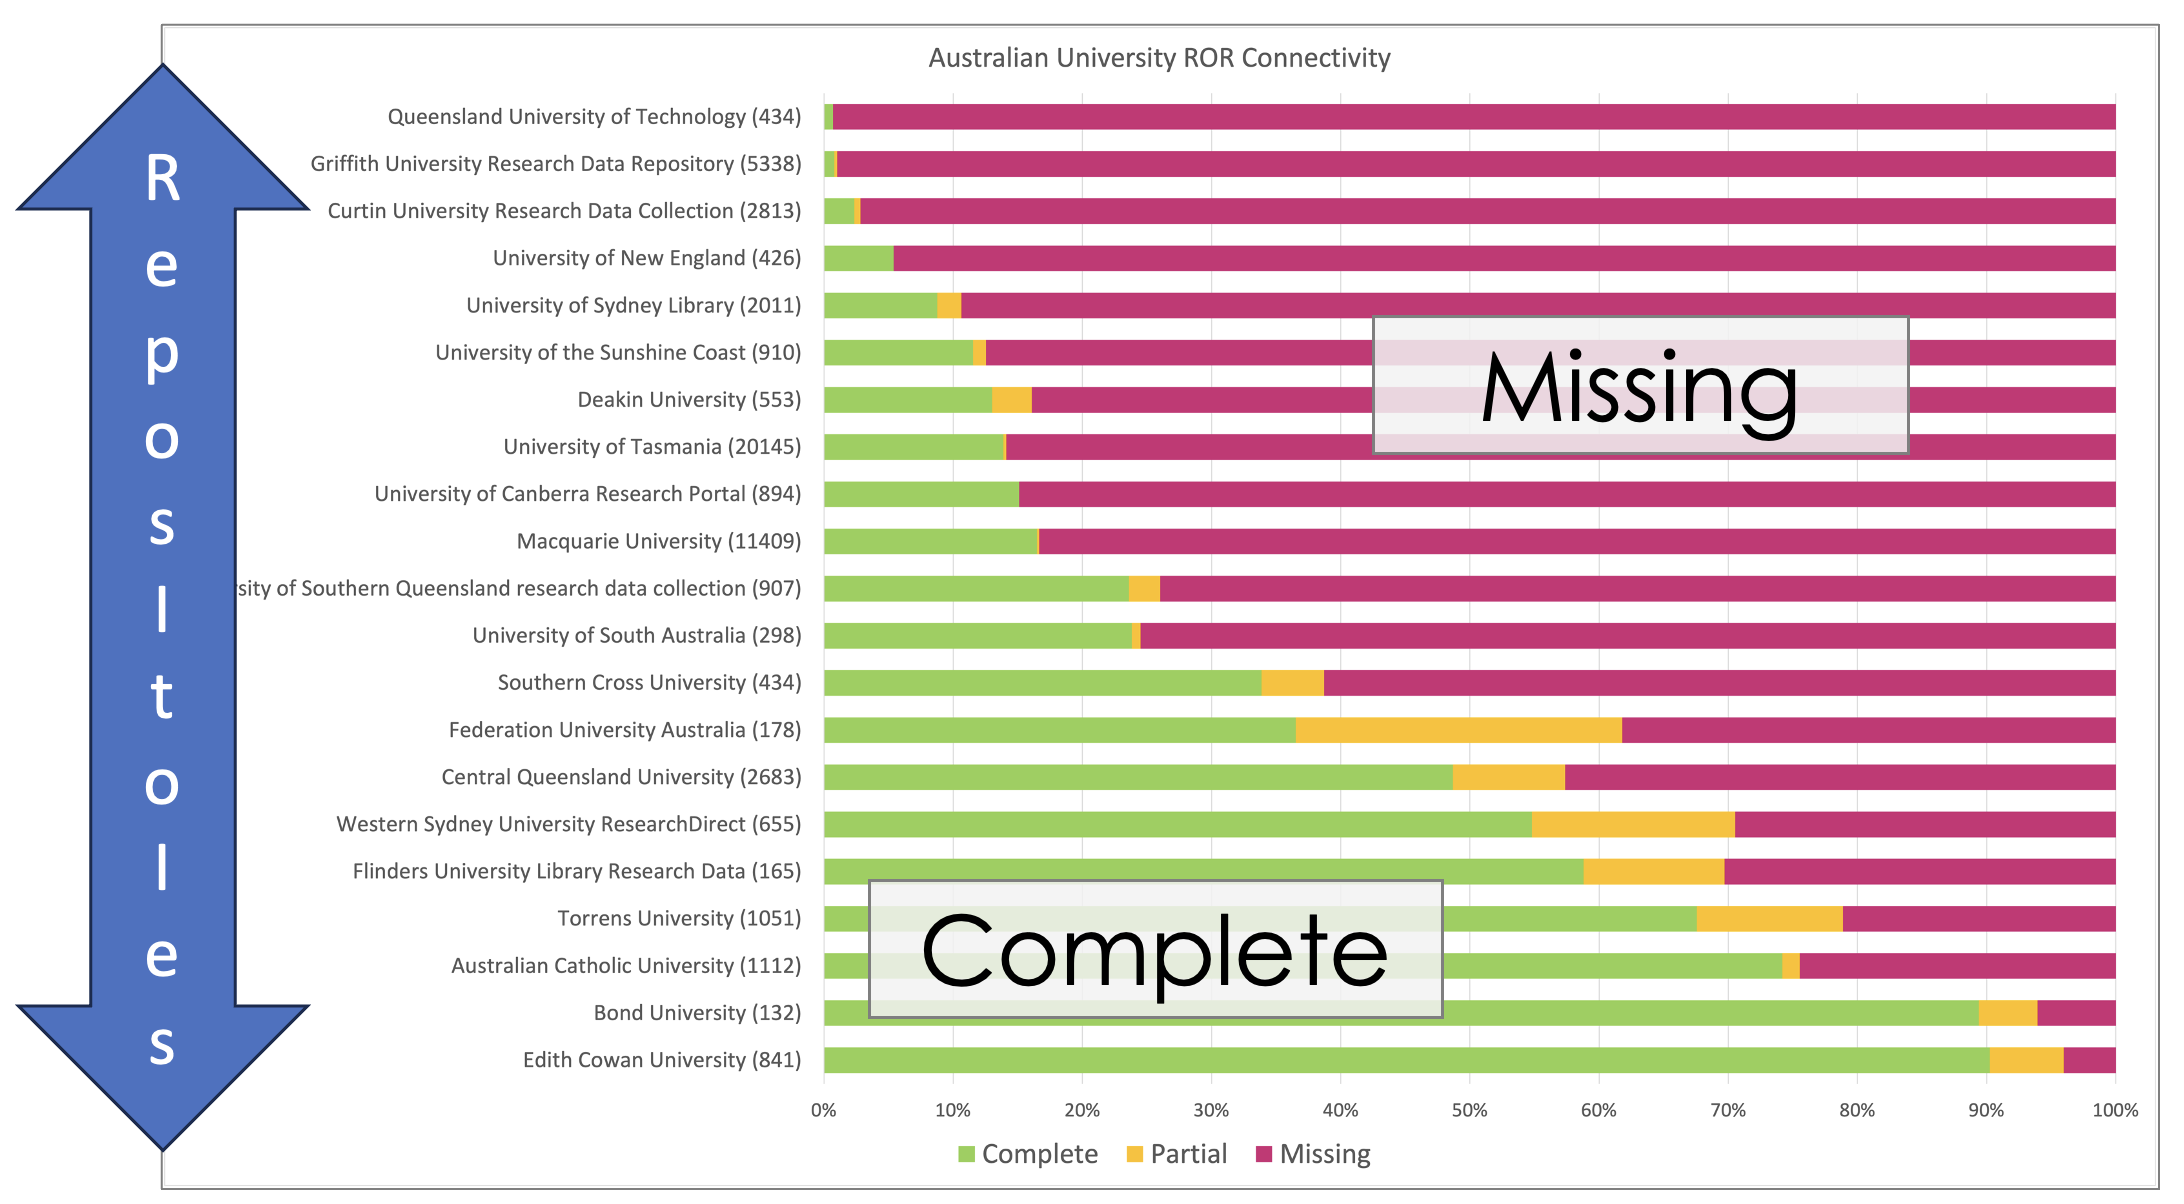
Connectivity can be compared across groups of related repositories that are working together with the same completeness goals. For example, multiple Universities in Australia are working to improve completeness of affiliation identifiers in their repositories. Figure 4 shows connectivity for creator affiliation identifiers (RORs) across twenty-one of these repositories. The colors are the same as in Figure 3. Comparisons like this facilitate identification of repositories that can serve as bright-spots and examples of successful practices. As other repositories successfully improve their coverage, the overall plot becomes greener, indicating system-wide improvement.
Figure 4. Creator affiliation identifier connectivity for 21 Australian universities. Repositories with more complete connectivity (Brightspots) are clear near the bottom of the plot.
Recording and Slides
The recording of the session is available as are my slides.
References
Habermann, T. (2023). Improving Domain Repository Connectivity. Data Intelligence, 5(1), 6–26. https://doi.org/10.1162/dint_a_00120
Habermann, T. (2024). University and College Connectivity @ DataCite. Blog - Metadata Game Changers. https://doi.org/10.59350/w95qm-ann38


