
Community Can Help Improve Metadata
/Ted Habermann, Metadata Game Changers
One of the highlights of the recent DataCite annual business meeting was the overview by DataCite executive director Matt Buys. He did a great job describing significant recent accomplishments and painting a bright future as DataCite continues to grow membership, services and capabilities.
Two items that Matt touched on were particularly interesting for me: 1) advancing tools that help organizations understand and improve metadata and 2) the importance of many communities around the world for DataCite members. Combining these two items raised questions about the role(s) of communities in helping members understand and improve metadata.
Can recent work on measuring metadata FAIRness and identifying bright spots help communities plan and facilitate the metadata improvement process?
My first exposure to the important role of bright spots in facilitating change came in the work of the Positive Deviance Collaborative and Data Powered Positive Deviance, two organizations focused on making significant change all over the world. Bright spots are individuals or communities that achieve remarkable success or exhibit highly effective behaviors despite facing the same constraints as their peers. These ideas have helped address really hard problems, e.g. rice yields for Indonesian farmers and Somali rangeland preservation during droughts. They can certainly help us improve metadata around the world.
In the context of DataCite, bright spots are repositories that create and share remarkable metadata even though they face the same challenges that all repositories face. A recent blog post identified bright spots across over 3,000 DataCite repositories, focused some attention on repositories with outstanding metadata improvements during 2025, and showed that many DataCite consortia include bright spots among their members. We extend this final idea here with more detail to characterize the distribution of metadata completeness across communities at several levels and explore how communities might make concrete plans for improving their metadata.
DataCite Communities
Communities within DataCite can be defined in many ways. At the most “hands-on” level, there are repositories that create and manage metadata records. As of January 2026, there were 3414 DataCite repositories. The repositories are associated with over 1700 DataCite members that can be “Direct Members”, i.e. independent, or they can be associated with one of over 60 consortia that, as of January 2026, varied in size from one to 420 repositories with seven having over 100.
There is another set of groups reflected in DataCite repository identifiers. These identifiers have two parts separated by a “.” and the first part is called a “provider”. The term “provider” has existed since the beginning of DataCite when repository identifiers generally had more semantics. Today, providers are less meaningful and more fluid than consortia. There are 1092 providers in DataCite that vary in size from one to 220 repositories with four having over 100 repositories.
These groupings are used here because 1) they are readily accessible either through the DataCite API or through repository identifiers and 2) they are hopefully useful in some cases as members know their repositories and repositories know their providers from their identifiers and 3) hopefully they may be useful for creating or thinking about metadata improvement cohorts. The analysis and data used in this sturdy are at the repository level and they include the providers and consortia used for grouping.
Specifics of how groups are defined are not critical. The real goal is to somehow define groups of repositories that might support collaborative metadata improvement efforts. Once you find these groups, stick with them!
Metadata FAIRness Distributions
Our FAIRness measures have focused on four use cases that map to over 60 specific DataCite elements to measure metadata FAIRness: Text, Identifiers, Connections, and Contacts. These mappings provide specific guidance for metadata improvements for each use case and, when combined, provide an overall measure of metadata FAIRness that has been used to quantify and compare FAIRness across repositories, and to identify overall bright spots (Habermann and Robinson, 2024a, 2024b, 2025a, 2025b).
In this work we want to explore and compare FAIRness across groups of repositories, whether they be in consortia or in provider groups. This can be done using boxplots like that shown in Figure 1. This Figure summarizes data for all 3414 repositories shown in Figure 1 of Habermann and Robinson, 2025b. It shows the overall minimum (3%) and maximum (61%) values as the left and right end of the horizontal line. The bottom of the 25% quartile (18%) and the top of the 75% quartile (29%) are indicated by the blue box while the median is indicated by the orange diamond and the vertical dashed line.
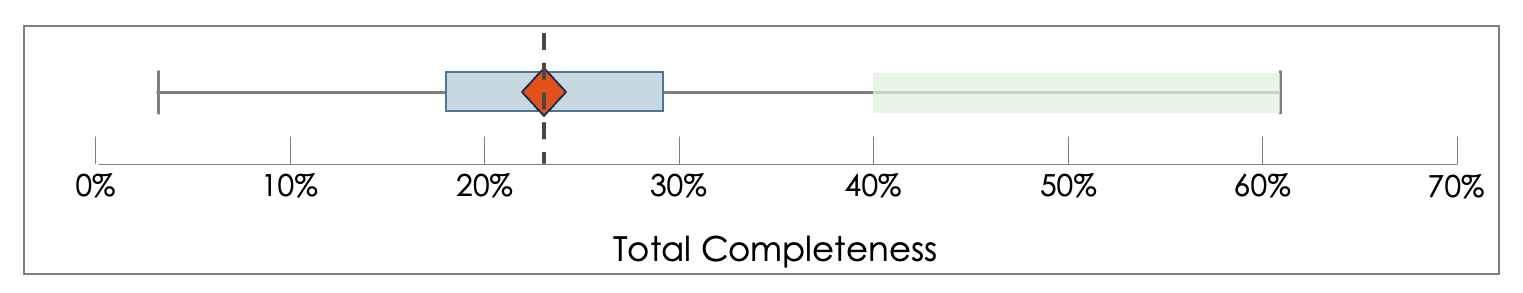
Figure 1. Box plot showing the distribution of total completeness across 3414 DataCite repositories. The horizontal line shows the overall minimum and maximum values. The box shows the 25 and 75% quartiles. The diamond shows the median (50%). The vertical dashed line also shows the median and is used for visual comparison across other Figures.
Figure 1 shows that FAIRness of the DataCite repositories is rather tightly grouped around the median with 50% of the repositories between 18 and 29%. Repositories with only the DataCite required fields score 12% using this metric, so the overall minimum of 3% is an unusual case. The standard deviation of these data is 8% so repositories with values >= 40%,are bright spots two or more standard deviations above the mean (in the green box). Keep this in mind as we look at data for consortia and providers below.
DataCite Consortia and Provider FAIRness
Figure 2 shows box plots for all DataCite Consortia, adding more data and details to Figure 2 in Habermann and Robinson 2026. The median values for each consortium, shown as orange diamonds, vary from 15% to 39%. Twenty-three of the consortia have median values above the overall median of 23% (shown by the dashed line) while thirty-six have medians below the overall median. The green box in Figure 2 shows the bright spot range (>=40%). Twenty-two consortia have maxima in that range.
Can these data help DataCite communities improve their metadata? All significant change occurs is a series of cycles and each improvement cycle starts with understanding where you are. Hopefully these plots help consortia and repositories understand and compare their starting points.
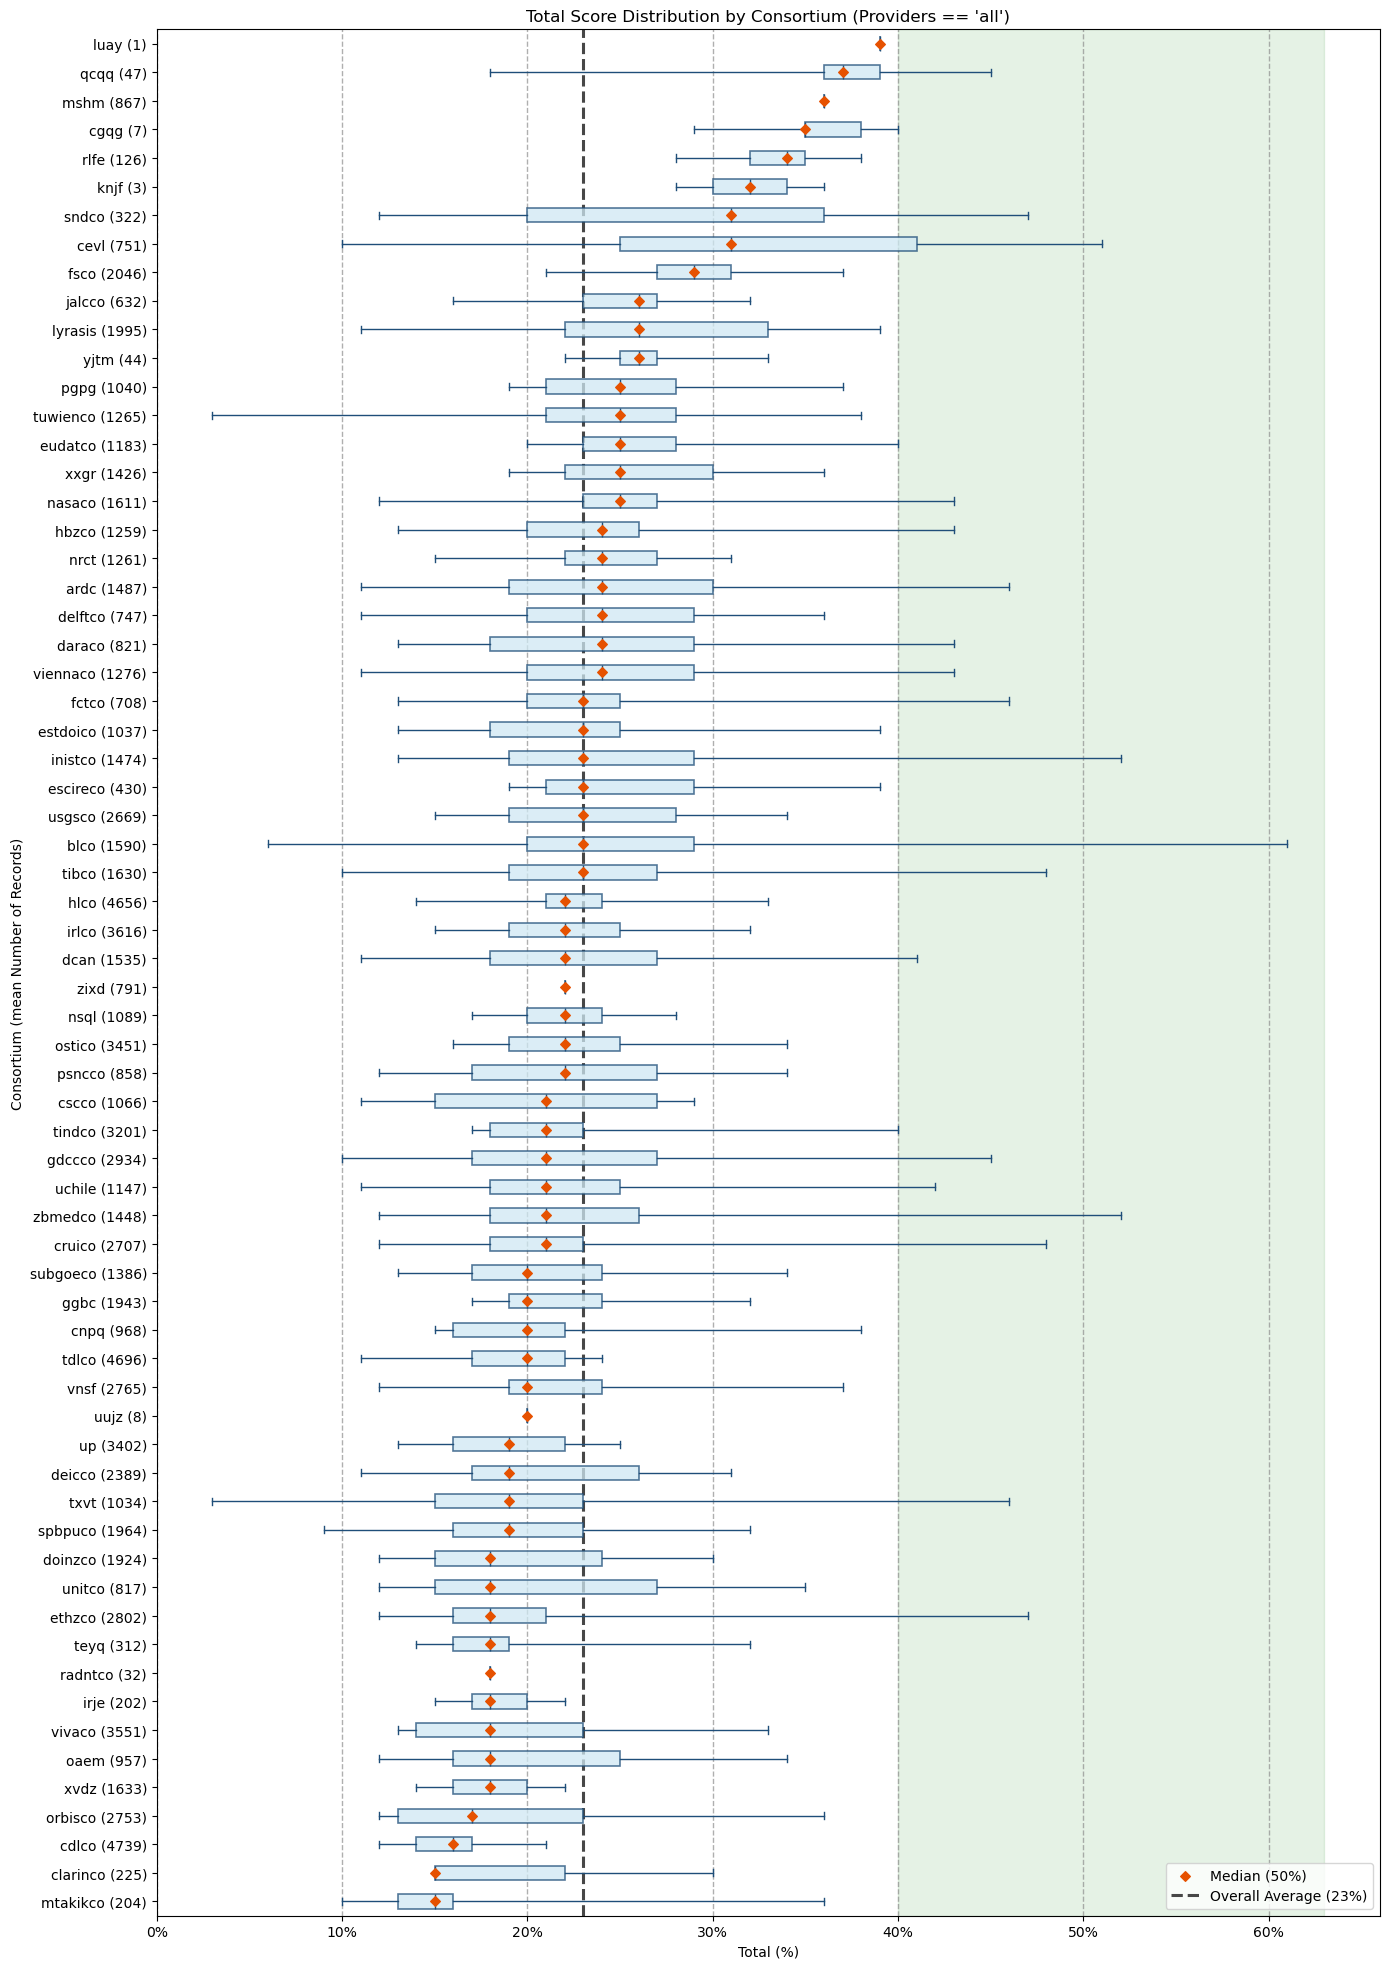
Figure 2. Box plots for 66 DataCite consortia. The numbers in parentheses are the average number of records in the repositories for each consortium. They provide a general idea of the size of the consortium metadata collections. Consortia with one repository show as single points. The vertical dashed line is the overall median of all repositories (23%). The green box shows the bright spot range determined from all repositories (>=40%).
Making a Plan
Figure 2 shows that there is quite a bit of variation across DataCite, so there is no single silver bullet. A couple of high-level ideas might be helpful.
The first step is to choose communities that make sense. These might be a consortium or a provider. If your repository is a consortium member, take a look at the box plots for providers in your consortium to understand similarities and differences and compare your provider to others in your consortium. These plots include the overall average (23% vertical dashed line), and the bight spots (green box > 40%) to connect back to the bigger picture.
It could be that your community is a set of comparable repositories based on other criteria. The full completeness dataset includes all repositories so it can be used for examining FAIRness details of any repository again to understand similarities and differences at a more granular level.
Work with you communities to engage them as co-conspirators in the metadata improvement task. That can be challenging, but it is critical to identify “accountability buddies” on the way to success of the whole group.
The second step is setting reasonable goals. Short term wins that can be accomplished in small steps are more important than lofty goals. Start ridiculously simple and build momentum through multiple improvement cycles.
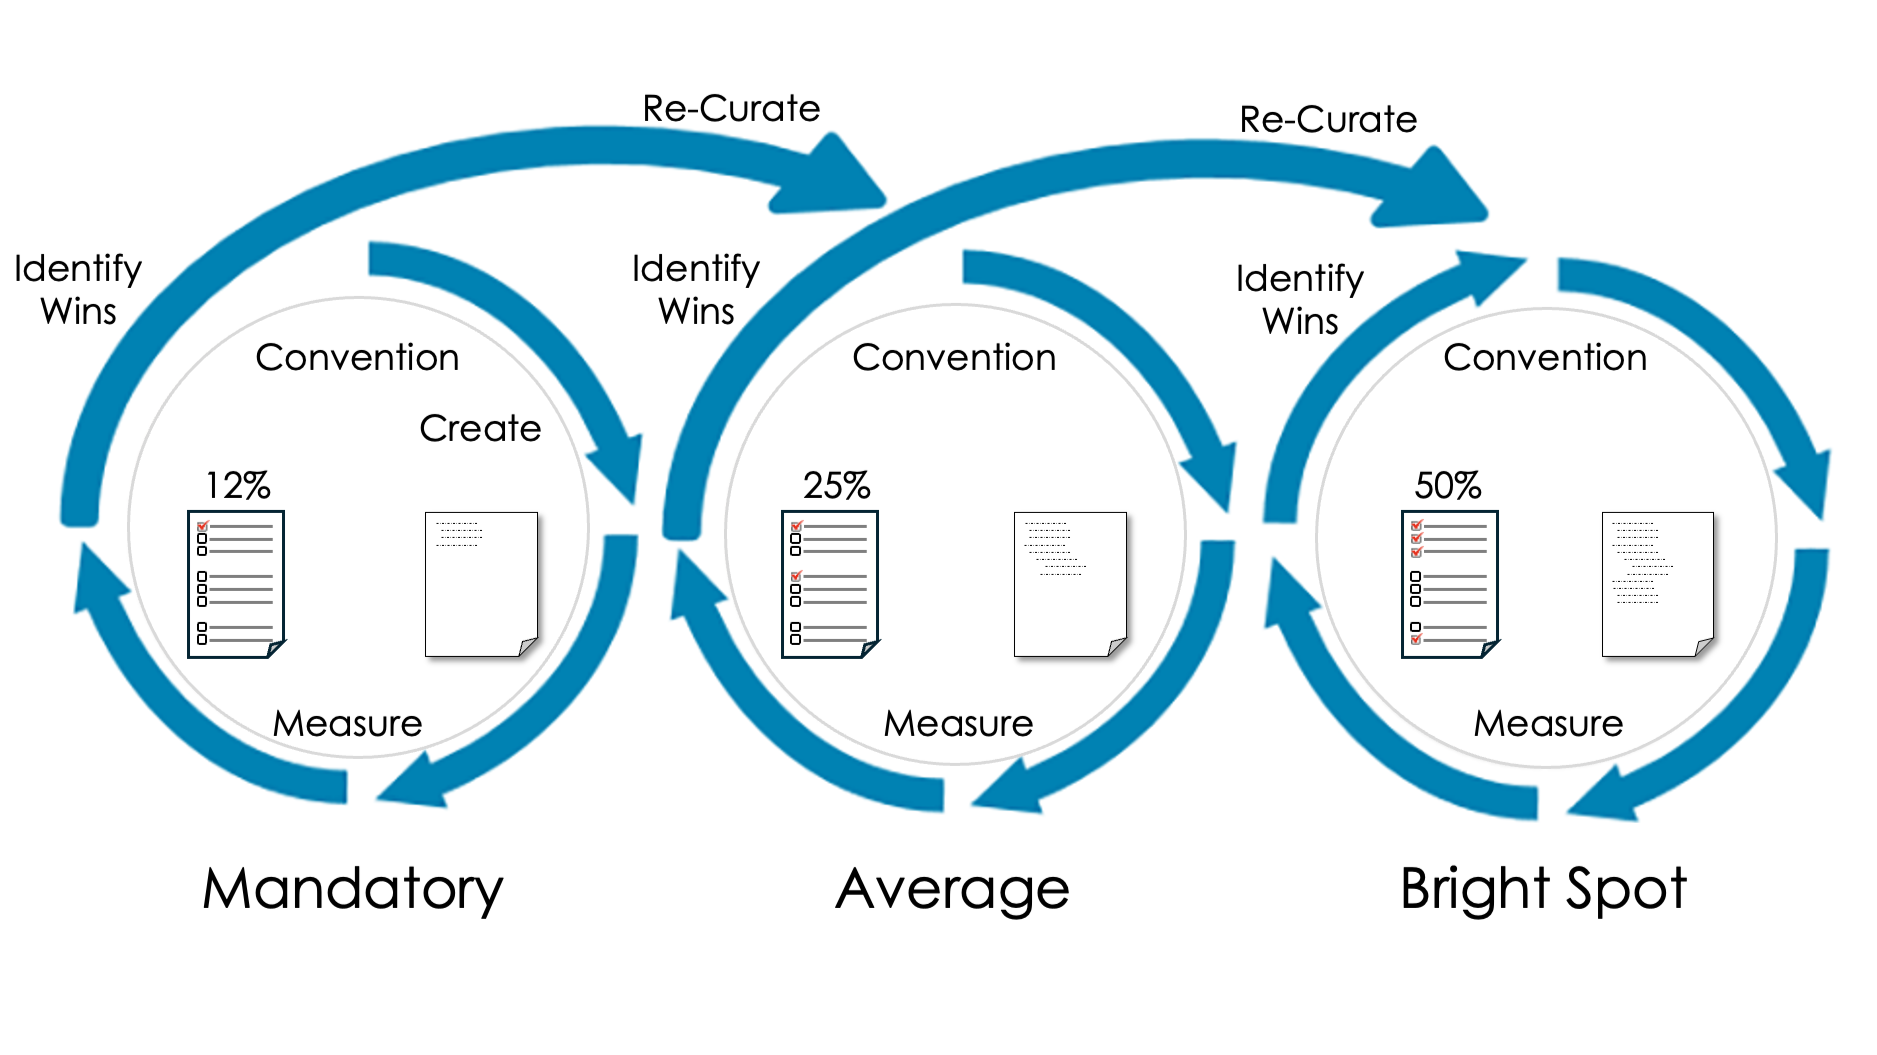
Figure 3. The end goal of improved metadata is accomplished through continuous improvement, a series of small steps that add up to the goal.
The third step is to make your goal specific. The FAIR Metadata Completeness notebook makes it possible to explore repository completeness for the four FAIR use cases that are combined in the overall scores used here. The notebook measures completeness for sixty-one DataCite metadata elements. Use those data to select initial metadata elements to focus on.
The fourth step is to establish a baseline for current metadata that can be used for comparison as improvements are made. These baselines improve through improvement cycles and are used to track and demonstrate success.
Many organizations support metadata in local repositories and share only some of their metadata with DataCite. The fifth step depends on specifics of your local metadata management tools and their interactions with DataCite. What metadata elements to they support? Do they facilitate creation, but not updates? If metadata are managed in a local repository, how do updated records get shared with DataCite? All of these questions need to be answered to ensure that improved metadata become integrated into the overall metadata picture.
If you are interested in taking a look at your consortium try our interactive consortium report notebook. An interactive notebook Of course we are available at Metadata Game Changers to help repositories with any step along the way.
References
Habermann, T. and Robinson, E., (2024a). FAIR DataCite Metadata - University and College Bright Spots. Front Matter. https://doi.org/10.59350/v6enq-99z90.
Habermann, T. (2024b). BrightSpots Get Brighter. Front Matter. https://doi.org/10.59350/prqvd-2f082
Habermann, T. and Robinson E. (2025a). DataCite Bright Spots. Front Matter. https://doi.org/10.59350/34brd-80j48.
Habermann, T. and Robinson E. (2025b). DataCite Bright Spots – Repositories, Consortia, and Improvements. Front Matter. https://doi.org/10.59350/v2may-69s52.
Habermann, T., & Robinson, E. (2026). Metadata Completeness for Four FAIR Use Cases for all DataCite Repositories (3.0) [Data set]. Zenodo. https://doi.org/10.5281/zenodo.18202119.