University and College Connectivity @ DataCite
/Ted Habermann, Erin Robinson, Metadata Game Changers
Cite this blog as Habermann, T. (2025). University and College Connectivity @ DataCite. Front Matter. https://doi.org/10.59350/w95qm-ann38.
Introduction
In several recent blogs we used a FAIR metadata recommendation to measure FAIRness of metadata in nearly 400 university and college DataCite repositories and identified several outstanding bright spots, i.e. repositories with exceptional metadata (Habermann and Robinson, 2024a, Habermann and Robinson, 2024b). That metric determines the % of records in a repository that contain some set of metadata elements, i.e. metadata completeness. In this blog we explore another method of repository evaluation termed “Repository Connectivity” and identify bright spots using this measure.
Repository Connectivity was originally proposed in the context of domain repositories using UNAVCO as an example (Habermann, 2023). UNAVCO supports instruments, data, and engineering for terrestrial and satellite geodetic technologies; GPS networks for Earth, atmospheric, and polar science applications; and the Global Navigation Satellite System (GNSS). It is an excellent example of a domain repository that has developed close, long-term relationships with their research community.
Institutional repositories at Universities and Colleges also support communities of researchers that work with the repositories to provide access to and preservation of datasets and other research objects. Our earlier work included a set of ~400 of these repositories. Here, we use that dataset from January 2024 to create a baseline for connectivity and compare current data to identify good examples of improving metadata.
Connectivity
Connectivity measures how well research objects or collections of research objects are identified and connected to the global research infrastructure through the PID Graph. These connections depend on identifiers for all kinds of research objects. Here I focus on people and organizations, typically identified by ORCIDs and RORs.
Connectivity can be quantified for any item or collection of items that can have identifiers. It is the number of existing identifiers divided by the number of possible identifiers. If no identifiers are present, connectivity = 0. If all potential identifiers are present, connectivity = 1.
The example Figure 2 shows a resource that has two authors. In this case the identifiers are ORCIDs, and connectivity can be 0 (no ORCIDs), 0.5 (1 ORCID), or 1 (2 ORCIDs).
The calculation is similar for a resource that has two affiliations (Figure 2). In this case, the identifiers are RORs and the connectivity can be 0 (no RORs), 0.5 (1 ROR), or 1 (2 RORs).
These calculations scale up easily to complete collections of resources, i.e. repositories. In those cases, the total number of possible person identifiers is generally the total number of authors across all resources and the total number of possible organizational identifiers is the total number of author affiliations which is typically greater than the number of authors because of multiple affiliations per author.
The raw units for connectivity are identifiers as it is a % of identifiers. The results can also be described in terms of categories, i.e. DOIs with Complete, Partial, or Missing connectivity where Complete means that all identifiers are present, Partial means that some identifiers are present, and Missing means that no identifiers are present. The % of complete and partial connectivity increases as improvements are made and repositories can select goals at two levels: all DOIs complete, or all DOIs partial.
The Big Picture
The repositories included in this sample provide a global sample of DataCite repositories for Universities and Colleges. Forty-two of these repositories have more than 10,000 records while the median number of records is 1360. All records were retrieved for repositories with less than 10,000 records and samples of 10,000 records were examined from the large repositories.
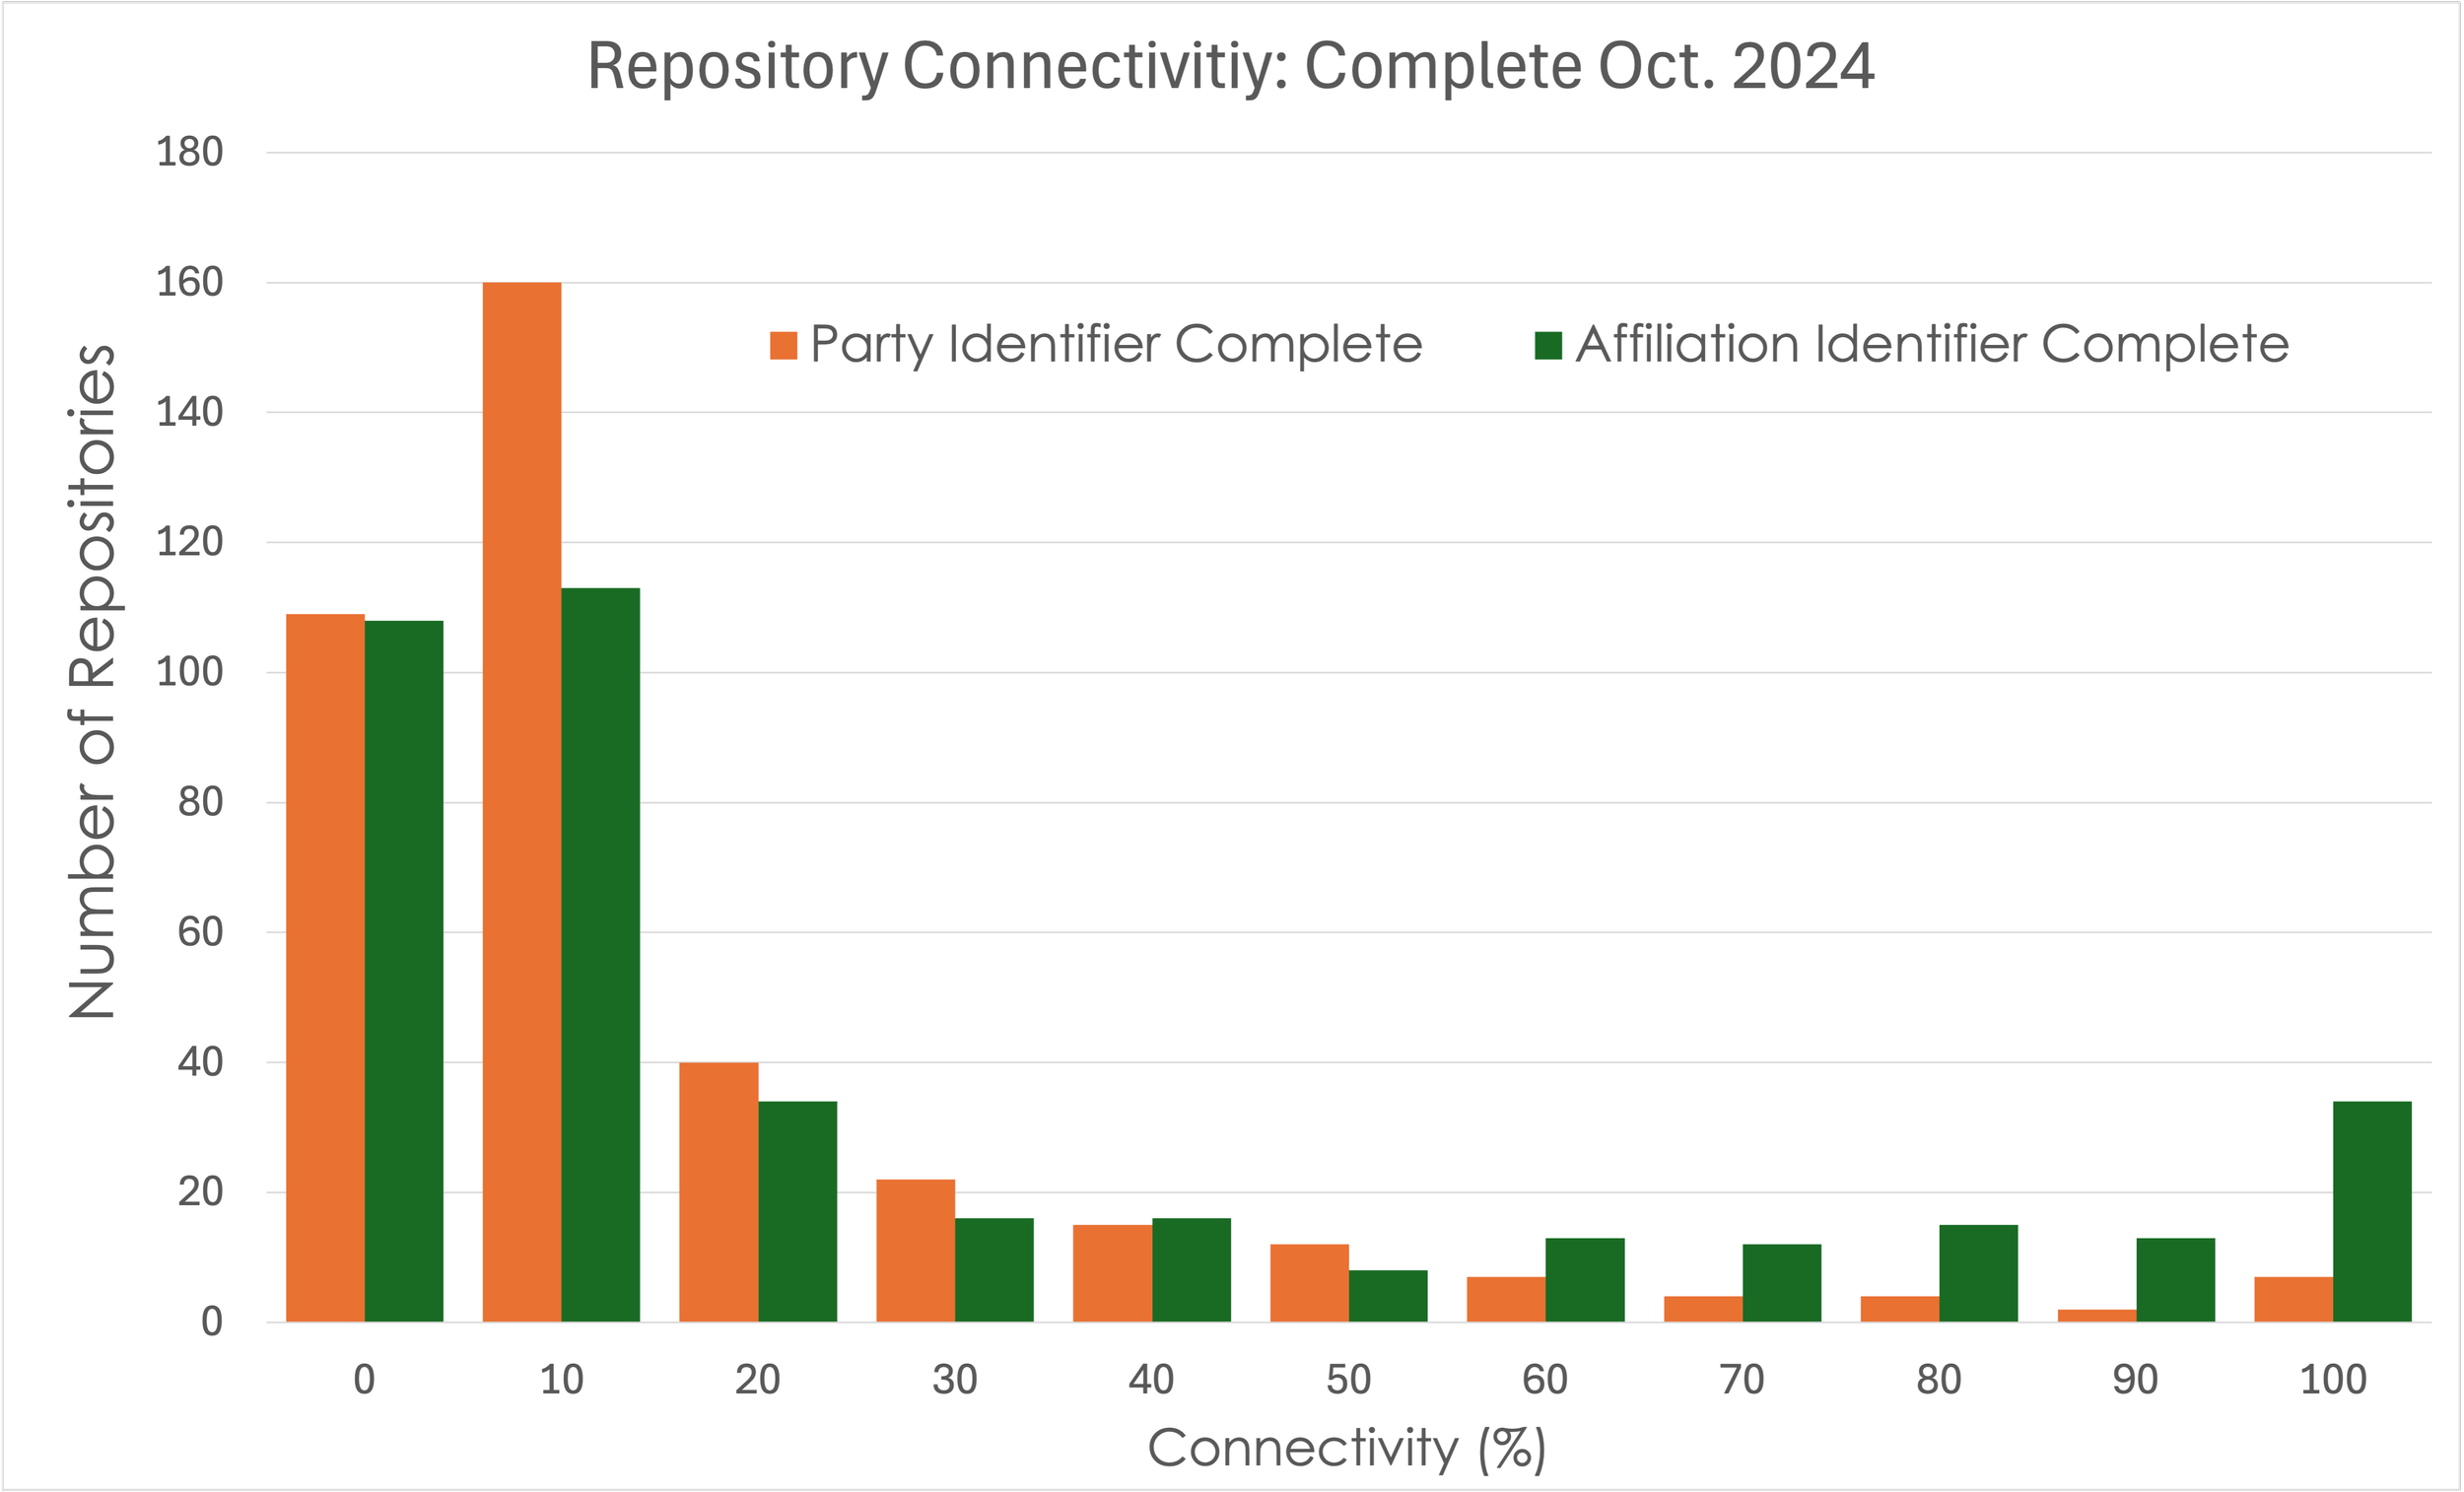
Current connectivity (October 2024) for authors and affiliations varies across the spectrum from zero to 100% with the most common connectivity being between 0 and 10% for authors and affiliations (Figure 3).
The average connectivity, shown in Table 1, is very consistent across time and identifier types. The percent of resources in the repositories that have all author identifiers, i.e. complete, is between 10 and 11% and consistently higher for organizational identifiers (23 to 24%). The percent of resources that are missing all identifiers is between 73 and 83%. It is interesting to note that the complete affiliation connectivity is two times greater than the party identifier connectivity, likely reflecting the pattern that affiliation identifiers are generally more common and easier to find than author identifiers.
Author Identifier
Organizational Identifier
Date
Missing
Partial
Complete
Missing
Partial
Complete
January 2024
83%
6%
10%
74%
3%
23%
October 2024
82%
6%
11%
73%
3%
24%
Table 1. Average connectivity for samples during January and October 2024.
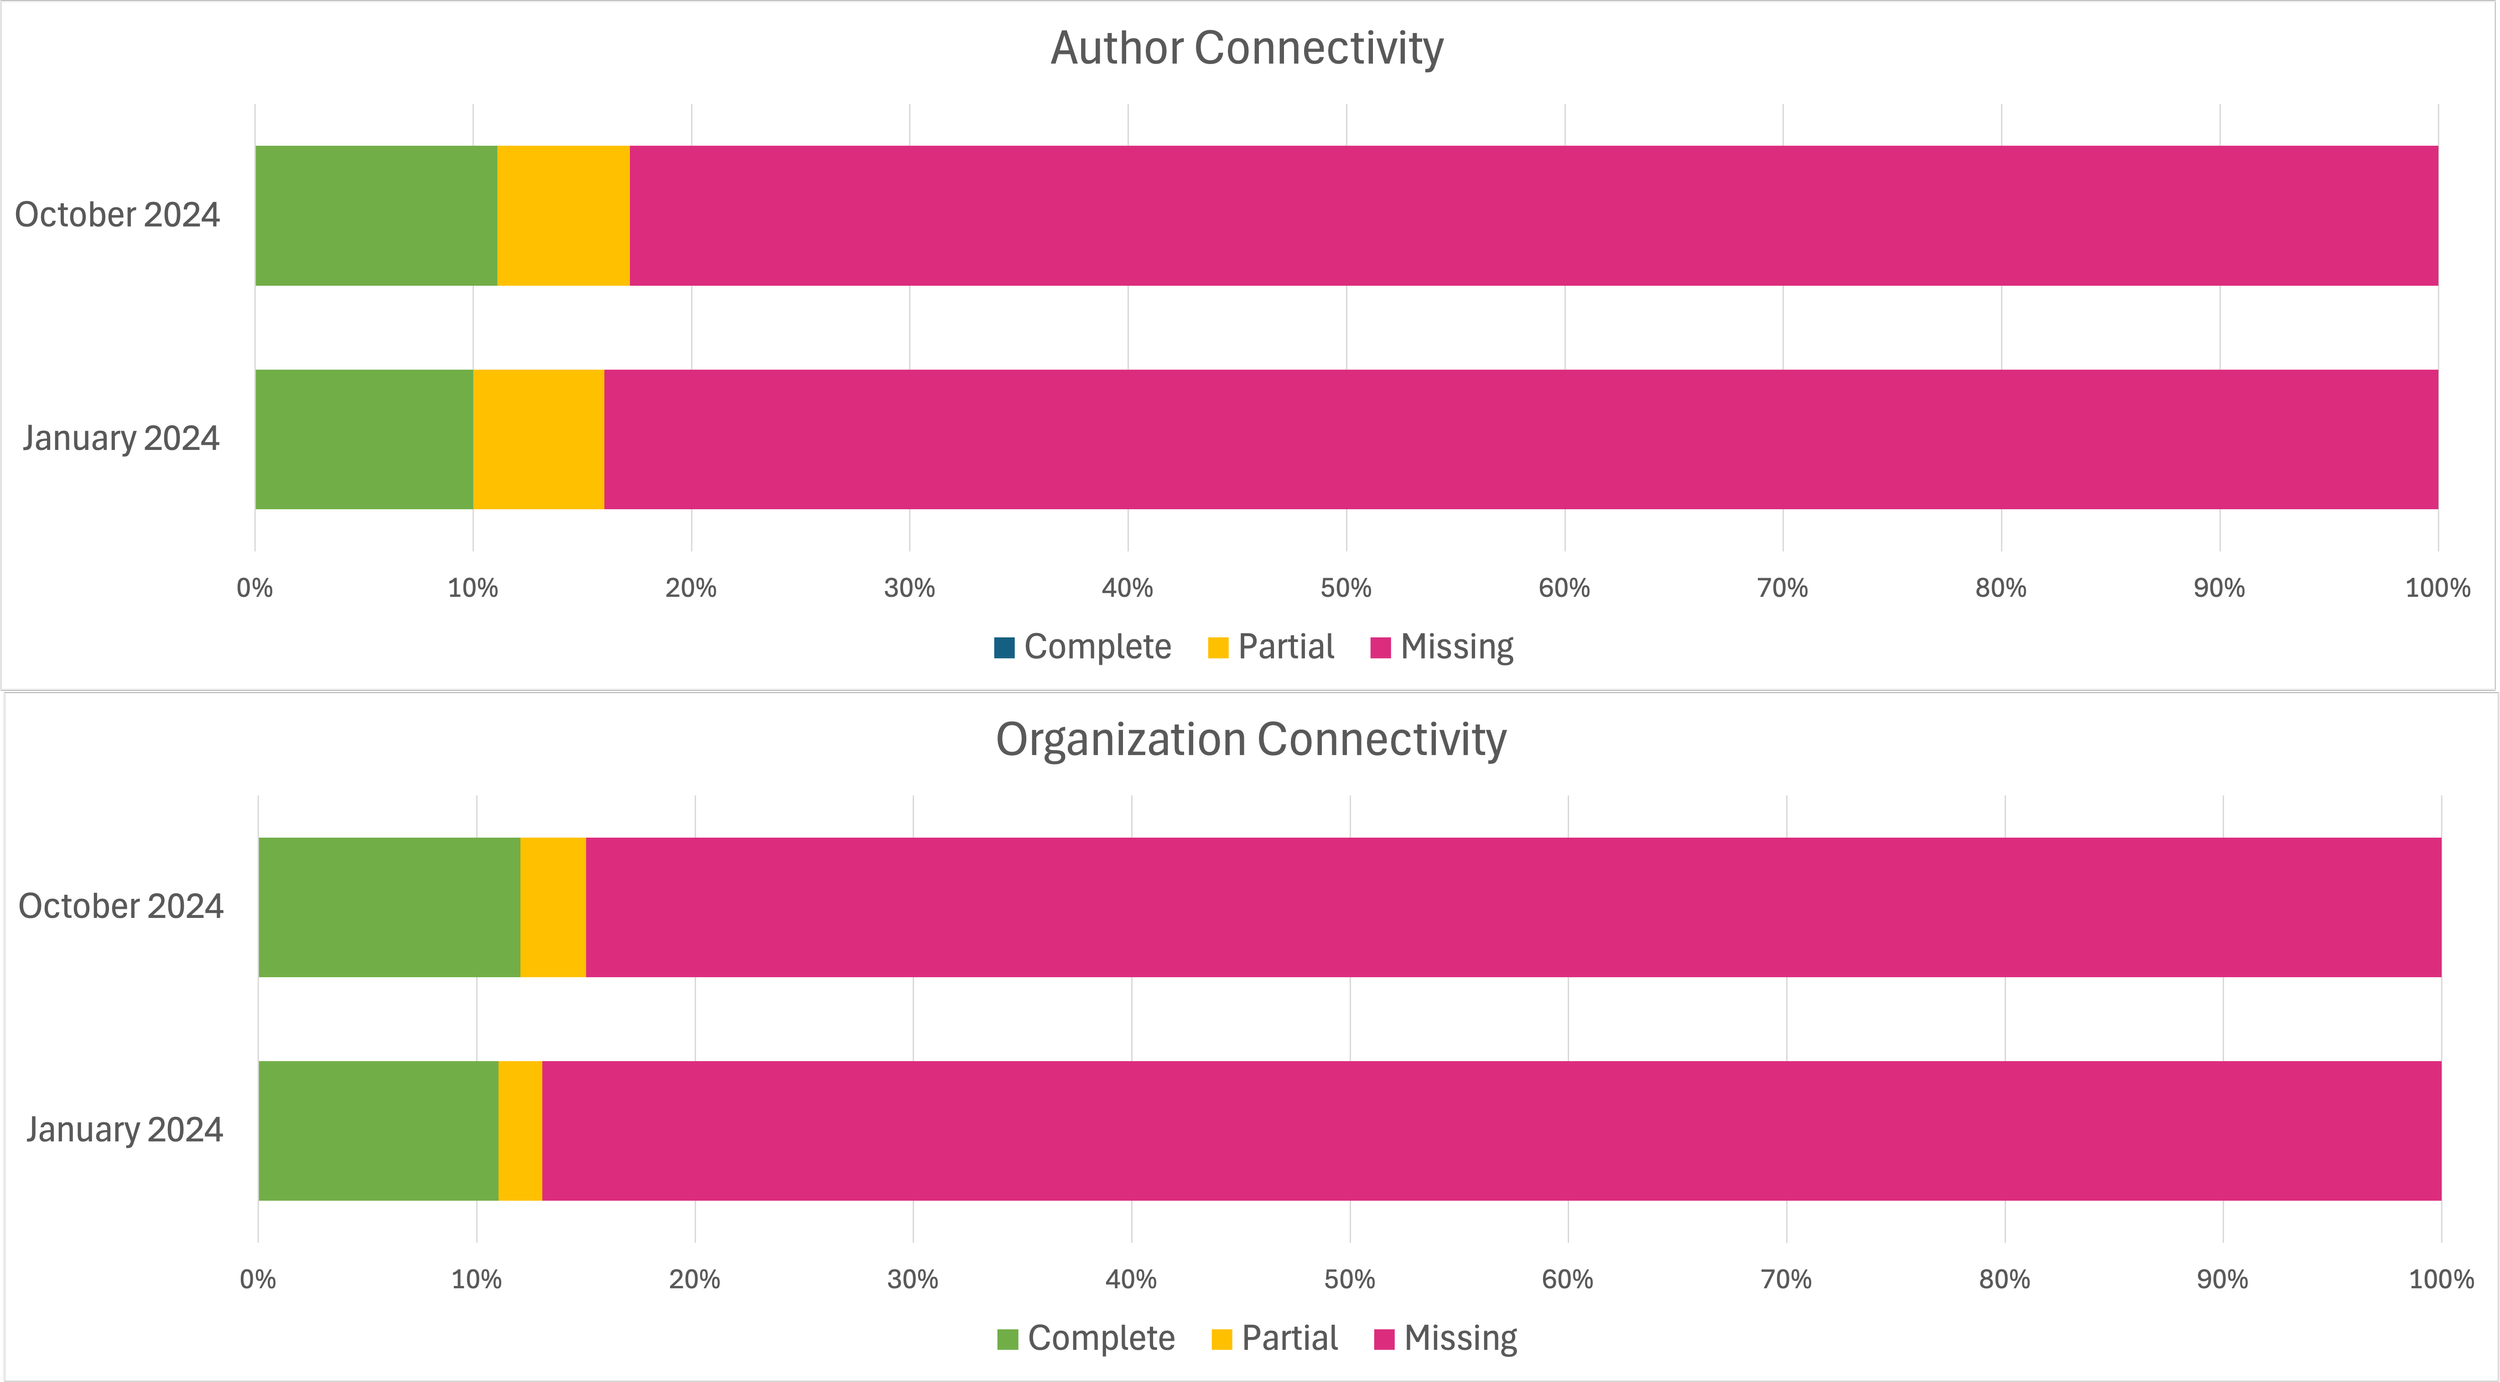
The similarity for the two types of identifiers is also evident in the graphical representation, described by Habermann, 2023, shown in Figure 4. The green portions of these bars show the % of resources with complete connectivity with partial and missing being yellow and red. This part of each bar expands to the right with the missing and partial portions getting smaller as improvements are made to the repository metadata.
Figure 4. Visual representation of the connectivity for all authors (top) and organizations (bottom) for samples during January and October 2024. The % of resources with Complete, Partial, and Missing Connectivity are indicated by green, yellow, and red portions of the bars.
This overall average provides a baseline connectivity that has not changed since January. Repositories can be compared to this baseline to identify those with outstanding connectivity (bright spots).
Bright Spots
The goal of any metadata assessment across a large selection of repositories is to define the general baseline (Figure 4) and to identify repositories that are doing well, i.e. providing examples for others working to improve their metadata. In this set of observations there are bright spots in several categories.
Author Connectivity
Seven repositories have complete connectivity for more than 90% of their resources in the sample from October 2024 (Table 2). Exploring the metadata for these repositories in more detail sheds light on the variety of resource types in DataCite and the complex relationship between identification and connection use cases in these metadata. Table 2 includes record counts for common Resource and Identifier Types as indicators of repository characteristics. There are more identifier types than records because of multiple authors and/or multiple identifiers / author.
Repository
#
M
P
C
ResourceType (#)
Identifier Type (#)
Wroclaw University of Economics and Business A knowledge and research potential platform (nsyy.wuebir)
419
100%
Report (279), Dissertation (140)
OMEGA-PSIR (698), ORCID (463)
Université de Liège (ulg.prod)
10000
100%
Dataset (10,000)
ORCID (64,010)
Lamont-Doherty Earth Observatory, Columbia University (tib.ldeo)
9942
100%
Dataset (7748), Image (287)
MGDS (11,803), UTIG (934)
University of Campinas (gdcc.unicamp)
6180
3%
5%
92%
Dataset (6108)
ORCID (14,117)
Université de Strasbourg (inist.unistra)
146
8%
1%
91%
Text (145)
ORCID (134)
Data Repository University Oldenburg (bisold.dareuol)
7,154
7%
2%
91%
Dataset (7,154)
ORCID (13,207)
University Library of Southern Denmark (dk.sdub)
744
10%
90%
Dissertation (499), Text (226)
Other (752)
Table 2. Author connectivity for six repositories which have complete author connectivity for over 90% of the resources sampled.
The Wroclaw University of Economics and Business repository holds primarily reports and dissertations and has identifiers for 100% of the authors in their repository. Most of these (60%) are local identifiers minted using an institutional repository management system developed at the university (OMEGA-PSIR). The Lamont-Doherty Earth Observatory at Columbia University also uses local identifiers associated with a local data management system, in this case the Marine Geophysics Data System (MGDS). The University Library of Southern Denmark also use local identifiers for authors, but in those case, they are full researcher names. In these three cases, these are unique and persistent identifiers for these researchers that support identification and connectivity within the home institutions, but do not typically support connectivity with other repositories on the global level.
The Université de Liège has author identifiers for all authors in all 10,000 resources sampled from the repository. Most of these resources (8,800) are datasets or data files published during 2023 by nine authors, all of which have ORCIDs (see Creators and Contributors on DataCite Commons). The University Oldenburg repository has a similar pattern with 6,441 datasets published during 2024 by two authors, both of which have ORCIDs (see DataCite Commons). The University of Strasburg is a small repository (146 records) and ORCIDs for six authors, one of which occurs 112 times.
Of the seven author identifier bright spots, the University of Campinas has the most varied set of ORCIDs. Their metadata includes 628 ORCIDs that occur over 14,000 times. One author occurs over 1300 times, 3 occur more than 500 times, and 30 occur over 100 times.
It is important to keep in mind that unique local identifiers in a repository are an important step towards unique connected identifiers. Once local identifiers are mapped to ORCIDs, the connections can be made quickly and automatically. Fortunately, the DataCite Metadata Schema supports multiple identifiers for creators and contributors so local and global identifiers can co-exist!
Organization Connectivity
Nine repositories have complete connectivity for author affiliations for over 90% of their resources (Table 3). In this case, the identifier types are either RORs or GRIDs, the identifier created by Digital Science that formed the seed dataset for ROR (GRID, 2021). Figshare is a division of Digital Science and the data for two Figshare repositories, the University of Johannesburg and the University of Cape Town, reflect the on-going transition between these two identifier types with mixtures of RORs and GRIDS.
Repository
#
M
P
C
ResourceType (#)
Identifier Type (#)
University of Johannesburg (figshare.uj)
10,000
100%
Other (9,980)
GRID (9,180), ROR (891)
Université de Liège (ulg.prod)
10000
100%
Dataset (10,000)
ORCID (64,010)
Kunstuniversität Linz
321
1%
99%
Other (316), Dissertation (5)
ROR (329)
University of Tampa Institutional Repository (tamplive.repo1)
2,036
1%
99%
Text (,1879), JournalArticle (135)
ROR (2,077)
University of Cape Town (UCT) (figshare.uct)
10,000
2%
1%
98%
Other (9,807)
ROR (6,650), GRID (3,278)
Columbia University Libraries (cul.cuit)
213
3%
97%
Dataset (213)
ROR (207)
Repositorio Institucional de la Universidad Especializada de las Américas (yygu.vtctpc)
721
4%
1%
95%
Dissertation (518), JournalArticle (145)
ROR (847)
University of Bath (bl.bath)
709
1%
4%
95%
Dataset (705)
ROR (2,372)
Memorial University Research Repository (mun.research)
1,739
7%
93%
Text (1634)
ROR (1,618)
Table 3. Affiliation connectivity for eight repositories which have complete affiliation connectivity for over 90% of the resources sampled
The other repositories in Table 3 have only RORs as affiliation identifiers. Most of these repositories have resources from a small number of organizations, so they only need a small number of RORs to achieve high levels of connectivity. For example, the Technical University of Crete repository includes 11,489 occurrences of the ROR for the Technical University of Crete (https://ror.org/03f8bz564) and it is the only ROR in the repository. All but two of these repositories have less than 10 unique RORs. The bl.bath repository has 180 unique RORs with the ROR for the University of Bath making up 77% of the occurrences. The University of Tampa Institutional repository has 18 unique RORs with the ROR for the University making up 99% of the occurrences.
The pattern of the home of the institutional repository being the most common affiliation in the repository is not unexpected. It was first described in the context of organizational identifiers by Habermann, 2019. These repositories demonstrate that institutions can increase their connectivity by adding even just their own ROR to their metadata.
Bright Spots
The connectivity results in Table 1 and Figure 4 demonstrate that we are in the early days of identifier adoption in DataCite metadata, so it is important to identify and recognize repositories that are making progress. Figure 5 shows examples of outstanding improvements in connectivity for organizations and authors at three institutional repositories. The bars compare connectivity data from January 2024 (below) to data from October 2024 (above). The increased connectivity is indicated by the increase in the size of the complete (green) portions of the bars. At the University of Bath the portion of resources with complete organizational connectivity These improvements are particularly noteworthy at University Oldenburg where connectivity increased while the number of records increase by a factor of 10 during July 2024.
Figure 5. Improvements in connectivity for organizations and authors made during 2024 by three institutional repositories.
Conclusion
Repository Connectivity is the % of identifiers for people or organizations in a repository metadata collection. Resources in a repository can have Complete Connectivity when all possible identifiers are present, Partial Connectivity when some are present, and Missing Connectivity when none are present. Connectivity can be used as a metric for measuring progress along the road to uniquely and persistently identified research objects, people, and organizations recommended by the White House Office of Science and Technology Policy (OSTP, 2022).
Author and organization connectivity were explored for ~400 university and college repositories and examples of high connectivity were identified. Some of these examples reflect situations that may be unusual, for example, repositories with complete coverage by local identifiers or repositories with many resources with the same small set of authors. Nevertheless, identifying and understanding these cases is a piece in the puzzle of how repositories use DataCite metadata.
Like repositories with a small number of authors having a large portion of ORCIDs, there are many repositories where a small number of organizations, or the home institution itself, are the most common affiliation in the repository. In these cases, a small number of, or even just one, ROR provide a high level of connectivity for the home institution.
Establishing connectivity baselines is an important initial step to take before undertaking repository metadata improvement projects so that the improvements can be demonstrated to institution management and to other institutions. Brightspots that have accomplished progress are important “lights at the end of the tunnel” that other repositories are traveling through. They show that improvements can be done and can be used as examples for demonstrating the benefits of those improvements.
References
GRID, Global Research Identifier Database (2021), https://grid.ac/.
Habermann, T. (2019). How Many RORs Do We Need? Front Matter. https://doi.org/10.59350/4tbaw-m9382
Habermann, T.; Improving Domain Repository Connectivity. Data Intelligence 2023; 5 (1): 6–26. doi: https://doi.org/10.1162/dint_a_00120
Habermann, T. and Robinson, E., (2024a). FAIR DataCite Metadata - University and College Bright Spots. Front Matter. https://doi.org/10.59350/v6enq-99z90
Habermann, T. and Robinson, E. (2024b). BrightSpots Get Brighter. Front Matter. https://doi.org/10.59350/prqvd-2f082.
OSTP Public Access Memorandum, (2022), https://www.whitehouse.gov/wp-content/uploads/2022/08/08-2022-OSTP-Public-access-Memo.pdf
UNAVCO Available at: https://www.unavco.org/


