
Visualizing Crossref Repository Histories
/Ted Habermann, Metadata Game Changers
Introduction
Crossref is a critical stone in the foundation of the global research nexus, providing persistent identifiers and related metadata for nearly 200 million research objects. The term “persistent” here should not be confused with “static” as Crossref is updating metadata for an average of 4.2 million DOIs every month and provides great documentation guiding Crossref users through various update processes (Tkaczyk et al. 2026).
The process of updating metadata, termed re-curation, can occur on many scales. Large projects within the Crossref metadata matching project, for example, aim at adding persistent identifiers to funder metadata across the entire corpus. At the same time, members may be updating identifiers for people (ORCIDs) or organizations (RORs) or adding connections between research objects across some subset of records in their collections. These may be long-term, on-going projects or projects done in a few weeks.
In addition, members may adopt new practices that improve aspects of their future metadata. These are sometimes easier to identify because they look like jumps or ramps in the completeness time histories. The examples described below are in this category.
One of our goals at Metadata Game Changers is to help increase visibility for all these projects to facilitate sharing of successes, lessons learned, and capabilities across the Crossref community. We have extended our repository story telling tools (Habermann and Robinson, 2026a) to Crossref as a step towards this goal and share a couple of stories here to demonstrate this idea. Hopefully Crossref metadata managers can visualize and share their stories using these freely available tools.
Repository Histories
A recent blog post identified Crossref bright spots using Crossref Participation Reports to find members that had improvements in completeness between the backfile and current periods. One of these bright spots is Open Access Scholarly Journal Publishing (AOSIS), and their repository history demonstrates several metadata improvements.
Figure 1 shows the history of the AOSIS repository for three use cases adapted for Crossref metadata from the FAIR Use Cases developed as part of the MetaDIG Project (Habermann, 2019). The use cases focus on Text, Identifiers, and Connections. The mapping of 28 Crossref metadata elements to these use cases is described by Habermann, 2026b.
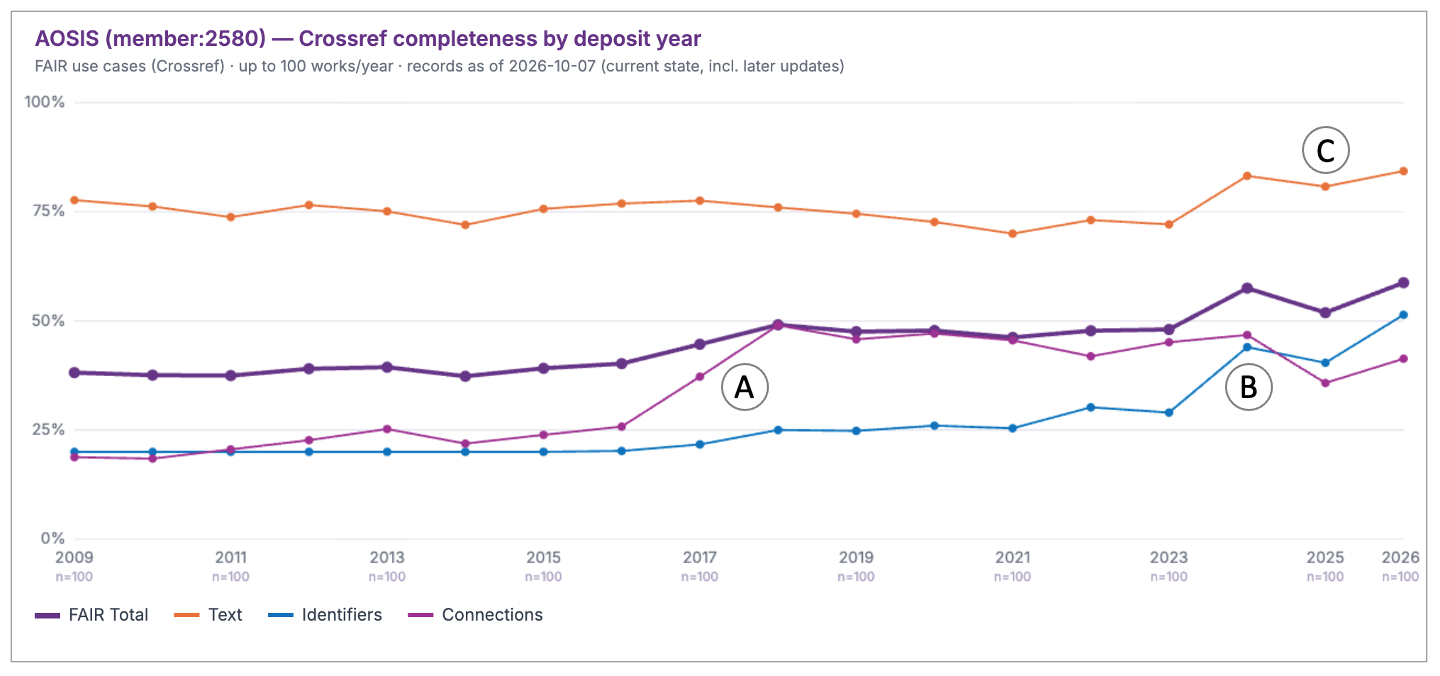
Figure 1. Metadata completeness history for Open Access Scholarly Journal Publishing (AOSIS) for three use cases including Crossref metadata elements focused on Text (9 elements), Identifiers (10 elements), and Connections (9 elements). Most of these elements are also included in the Crossref Participation Reports. Note two increases in completeness, i.e. metadata improvements, for (A) Connections during 2017-18 and (B, C) Identifiers and Text during 2024-2026.
The Crossref History Tool collects yearly metadata samples (in this case 100 records) and shows average metadata completeness for each use case as a line plot (Figure 1) and as a Table. AOSIS is selected in this link but you can change the member number or search for a particular journal using the ISSN.The AOSIS data show metadata improvements for the Connections use case (thin purple line) between 2017-18 (A) where the completeness increased from ~22% to ~49% and for the Identifiers use case (thin blue) where completeness increased from ~26% to ~45+% between 2024-26 after a slow, steady increase between 2017-23.
More details can be explored by selecting “Grid” from the view selector above the plot to show the data as a grid of yearly radar plots. Figure 2 shows these grids for three years. Each radar plot shows completeness for use case metadata elements around the plot with 0% in the middle and 100% on the edge. The goal of these plot strips is to show the big picture and facilitate comparisons across time periods. Overall completeness for this member is also available with element labels and more details including content for each use case. The baseline year, 2016, shows the stable repository behavior between 2009 and 2016 (Figure 2). The completeness for each use case shown above the radar plots is close to the long-term values in each case: Text = 77%, Identifiers = 20%, and Connections = 26%.
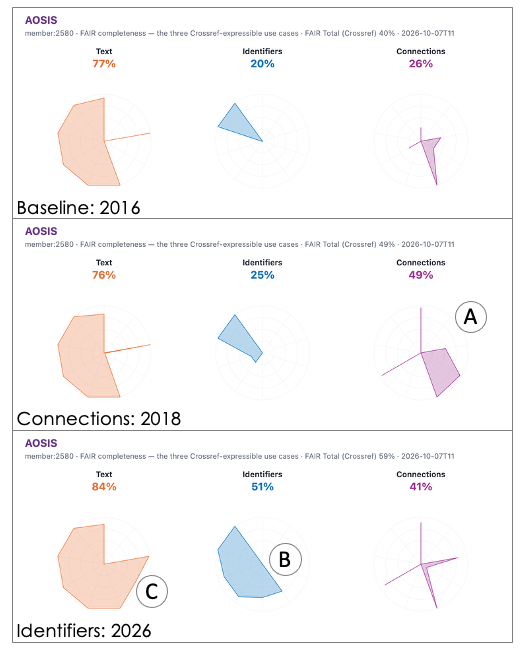
Figure 1. Radar plots of metadata completeness for three use cases and three years: 2016 is the baseline prior to improvements, 2018 shows the increase in connections and 2026 shows the increase in identifiers and text. Keys for the radar plots and more details are available here.
The Connection completeness (thin purple in Figure 1) increases between 2017-18 and the middle frame in Figure 2 (A) shows 2018 to capture details for that increase in the purple radar plot. The elements of the Connection use case that increased completeness are shown bold in Table 1 clockwise from the top of the radar plot. Large increases are clear for Date Available, Resource Format, and Rights. Smaller increases in references also contributed to the overall increase from 26% to 49%.
The bottom frame in Figure 2 shows use case completeness for 2026, the year after the improvement in identifier metadata (thin blue in Figure 1 and blue radar plot in Figure 2). Table 1 shows that this increase was focused in identifiers for Resource Author Affiliations (RORS) and Resource Authors (ORCIDs), filling in the lower left part of the radar plot (Figure 2B). The radar plot also shows a large increase in completeness for Resource Author Affiliations (Figure 2C) which is responsible for the increase in the Text use case in Figure 1.
Table 1 shows a sharp decrease in Resource Format completeness during 2026 with connection completeness decreasing from 49% to 41%. This is also apparent in the lower right of the radar plot in Figure 2. These tools make decreases in completeness visible in addition to the increases we focus most attention on. Once these changes are described, explaining them requires discussions with metadata creators and maintainers.
| Use Case | Concept | 2016 | 2018 | 2026 |
|---|---|---|---|---|
| Connections | Date Available | 29% | 96% | 89% |
| References | 43% | 53% | 80% | |
| Resource Format | 31% | 96% | 14% | |
| Resource URL | 100% | 100% | 100% | |
| Rights | 29% | 96% | 89% | |
| Identifiers | Resource Author Affiliation Identifier | 0% | 0% | 71% |
| Resource Author Affiliation Identifier Type | 0% | 0% | 71% | |
| Resource Author Identifier | 0% | 25% | 86% | |
| Resource Author Identifier Type | 0% | 25% | 86% | |
| Resource Identifier Type | 100% | 100% | 100% | |
| Resource Type | 100% | 100% | 100% | |
| Text | Resource Author Affiliation | 0% | 2% | 77% |
Figure 1 helps us identify the big-picture changes that have occurred in these metadata and Figure 2 shows the next level of detail about these changes. The tool also includes links for each year that provide in depth analysis of the completeness, content, connectivity for each year along with real-time searches for identifiers of people (ORCIDs) and research organizations or funders (RORs). These links show, for example, that during 2026, the metadata included 77 distinct author affiliations that occurred 232 times and that 200 of those occurrences included RORs and that the most common author affiliation so far during 2026 is University of the Witwatersrand with the ROR https://ror.org/03rp50x72.
Other Stories
Of course, this example from Open Access Scholarly Journal Publishing (AOSIS) is not unique. The Crossref community includes thousands of members that are actively working to enrich their metadata across a broad spectrum of resource types every day. Table 2 shows a few other examples that have emerged from work identifying Crossref bright spots.
| Crossref Member | Story |
|---|---|
| Fundación Universitaria de Ciencias de la Salud (16197) | Increases in Text, Identifiers, and Connections 2020-2026 |
| National Institute of Telecommunications (11176) | Increases in Connections since 2018 |
| Optica Publishing Group (285) | Long-term increase in identifiers (2013-2026) |
| Beewolf Press Limited (39746) | Increases in Text, Identifiers, and Connections 2022-2026 |
| SciPost Physics (2542-4653) | Increases in Identifiers (2024) |
| eLife (2050-084X) | Long-term increases in Identifiers with big increase during 2022. |
If you are a Crossref member with a metadata improvement story to tell, give the tools a try and let me know if they help you see your improvements and share your stories with colleagues, administrators, and the global research community. Knowing that others have faced and maybe overcome similar challenges can be very helpful as inspiration and sources of lessons learned!
References
Habermann, T. (2019). MetaDIG recommendations for FAIR DataCite metadata. https://doi.org/10.5438/2CHG-B074
Habermann, T. and Robinson, E. (2026a). Repository Journeys and Scrapbooks. Front Matter. https://doi.org/10.59350/4xafn-eap33.
Habermann, T. (2026b). Crossref Use Cases, https://metadata-game-changers.github.io/recuration-watch/crossrefUseCases.html, accessed October 7, 2026.
Tkaczyk, D., Hendricks, G., & Korzec, K. (2026). On metadata enrichment. Crossref. https://doi.org/10.64000/h6w1v-r1017.