
Crossref Participation Bright Spots
/Ted Habermann, Metadata Game Changers
Introduction
The concept of bright spots has been used as part of organizational change strategies across many domains and organizations (Marsh et al. 2004, Heath and Heath 2010). They are individuals or groups who are succeeding despite facing challenges like those faced by their whole communities. Bright spots serve as examples that the community learns from to develop effective solutions. It's essentially about recognizing that communities possess their own internal solutions, and that these solutions can be uncovered by studying and understanding those who have already overcome the difficulties.
An important first step towards the goal of metadata improvement is creating metrics that can be used to identify bright spots and as guides for metadata creators and managers. This concept has been applied to recognize a variety of types of bright spots in the DataCite community where metadata completeness was measured using four FAIR use cases (Habermann and Robinson, 2025), but it started with Crossref Participation Reports across 4000+ Crossref members and as a mechanism for quantifying metadata evolution over time (Habermann 2019a,b). The FAIR Use Cases and the Participation Reports serve the same role in these two frameworks by providing sets of recommendations to drive the metric calculations.
In this blog we analyze Crossref Participation Reports to identify overall and change bright spots and we revisit connectivity (Habermann 2021) to enable understanding metadata completeness in more detail. We also introduce freely available tools for connectivity and metadata evolution analysis of your Crossref metadata repositories. These tools are currently prototypes, so comments and suggestions are welcome.
Crossref Participation Reports
Participation Reports were introduced by Crossref during 2018 as a mechanism for measuring Crossref member metadata completeness and participation in various services (Tolwinska and Meddings 2018). These reports were re-introduced during 2024 with important additions of Affiliations and ROR Ids (Stoll 2024).
The Participation Reports interface supports interactive searches for any combination of member, period (backfile, current, all), and content type (see below) and gives results as completeness bars for ten items. The reports are also available using the Crossref members API: https://api.crossref.org/members/4374 where, for example, 4374 is the member id (eLife Sciences Publications, Ltd). The coverage-type section of the response gives participation reports data for all time periods and content types. These data are in JSON and include four items that are not displayed in the Crossref interface (Affil RORs, Funder RORs, Update pol. (Crossmark), and Descriptions). We currently include those items here, but they may be removed as we respond to suggestions.
We used the API to retrieve Participation Reports data for ~30,000 Crossref members and over 164,000 member / time period / content type combinations. This corpus can be used to empirically define the complete population of Participation Reports. Figure 1 shows the distribution of the average Participation Report scores for all content types that have more than 300 occurrences.
Figure 1. Box plots showing distributions of average Participation Report scores for 12 content types with more than 300 occurrences. The median is a horizontal line; boxes show 25% and 75% quartiles, whiskers extend to the most extreme value within 1.5 × IQR (Q3 − Q1) of the quartiles; points beyond are outliers. The number of members included for each content type is shown in the axis labels.
The median Participation Report average, shown in Figure 1, is below 10% for all content types except journal-article with a median of 21% for all time. For journal articles the median is 18% during the backfile (2023 and earlier) and 25% during the current time (2024-2026). In addition to being more complete than other content types, journal-articles currently make up 38% of the resources in Crossref so we focus on those in this blog.
Like the FAIRness data for all DataCite repositories (Habermann and Robinson 2025), this corpus provides context for Participation Report scores. Members with journal-article completeness scores >= 28% are in the top 25% and those with averages >= 60% are outstanding bright spots, the top 0.1% of all members. Table 1 shows these bright spots along with their size and average Participation Reports for journal-article, all time.
| ID | Member, Location | Records | DOIs | Average |
|---|---|---|---|---|
| 23445 | GigaScience Press, Hong Kong, Hong Kong SAR China | 189 | 189 | 83% |
| 4374 | eLife Sciences Publications, Ltd, Cambridge, United Kingdom | 22,980 | 116,621 | 74% |
| 54336 | Resilience Press, Trivandrum, Kerala, India | 35 | 35 | 72% |
| 53171 | Centre for Productivity and Sustainability Analysis, Vilnius, Lithuania | 38 | 38 | 71% |
| 8907 | Stichting SciPost, Amsterdam, Netherlands | 4112 | 12,628 | 70% |
| 12380 | Life Science Alliance, LLC, New York, NY, United States | 1804 | 1805 | 68% |
| 49041 | Office Khibrat Tibah for Research and Studies (Publications), Madinah, Saudi Arabia | 186 | 224 | 67% |
| 55866 | Scholiora Research Publications, Pune, Maharashtra, India | 46 | 50 | 66% |
| 54183 | Bookarion Publishing, Istanbul, Turkey | 21 | 35 | 66% |
| 49728 | Wildlife Institute of India, Dehradun, Uttarakhand, India | 73 | 84 | 66% |
| 55849 | Yayasan Ekologi Masyarakat dan Sains, Bandung, Jawa Barat, Indonesia | 69 | 76 | 64% |
| 23689 | Instituto Superior Tecnologico Ruminahui, Sangolqui, Pichincha, Ecuador | 273 | 291 | 64% |
| 27738 | Journal of Design for Resilience in Architecture & Planning, Konya, Turkey | 222 | 222 | 64% |
| 33042 | Joint Institute for Nuclear Research, Dubna, Moscow Region, Russia | 64 | 179 | 63% |
| 55830 | ICBS - International Center for Biomedical & Space Sciences, LIASTRA Institute, Pinheiros, Sao Paulo, Brazil | 6 | 6 | 63% |
| 6221 | National Institute for Health and Care Research, Southampton, Hampshire, United Kingdom | 3474 | 6084 | 63% |
| 55910 | Limited Liability Partnership PlasmaScience, Ust-Kamenogorsk (Öskemen), East Kazakhstan Region | 13 | 13 | 63% |
| 50033 | Universidad Andina Simón Bolívar, Sede Central, Sucre, Bolivia | 96 | 96 | 63% |
| 19163 | Belitung Raya Foundation, Manggar, Bangka Belitung, Indonesia | 819 | 895 | 63% |
| 50885 | Erevna Ciencia Ediciones, SANTO DOMINGO DE LOS TSÁCHILAS, Provincia, Ecuador | 94 | 132 | 62% |
| 16438 | Publishing House Sreda, Cheboksary, Chuvash Republic, Russia | 656 | 7140 | 62% |
| 53348 | Thong Nhat Hospital, Tan Binh, Ho Chi Minh, Vietnam | 164 | 164 | 61% |
| 54400 | Negocios Globales, Maracaibo, Zulia, Venezuela | 12 | 12 | 61% |
| 55708 | Fundación Amigos de la Salud Mental (FUNDASAME), Santo Domingo, Distrito Nacional, Dominican Republic | 55 | 55 | 61% |
| 57090 | Universidad Nacional de Mar del Plata, Mar del Plata, Buenos Aires, Argentina | 35 | 35 | 61% |
| 39025 | Universidad La Salle Arequipa, Arequipa, Arequipa, Peru | 243 | 268 | 61% |
| 53523 | Treatise LLC, Moscow, Russia | 11 | 11 | 60% |
| 54555 | Academia Aragonesa de la Lengua, Zaragoza, Aragon, Spain | 9 | 10 | 60% |
| 53201 | UNAD Florida University, Sunrise, FL, United States | 10 | 10 | 60% |
| 57038 | Grupo Afronta, C.A., Maracay, Aragua, Venezuela | 31 | 31 | 60% |
| 54583 | Brain Health Literacy Company Limited by Guarantee, Dublin 2, Co. Dublin, Ireland | 12 | 12 | 60% |
This group of bright spots reflects the variety and global extent of the Crossref community. The bright spots have a median size of 21 journal-articles and 223 DOIs as compared to 31 and 331 for the entire community. The IDs of these members can be used in the Crossref tools to explore the repository content in more detail.
Connectivity
Participation reports address important questions about how many member records include some metadata elements. For example, the ROR number is defined as “The percentage of registered records that include at least one ROR ID, e.g. in the contributor metadata.” In other words, the denominator in the number is the total number of records. This is similar to the approach used for measuring completeness of DataCite metadata (Habermann 2026) and used in the Crossref Completeness tool prototype. That tool explores completeness and content for the Participation Report items that are directly related to metadata content. It will be described in detail in a second blog.
Members that are working to improve their metadata are also interested in questions that provide more details about specific challenges they are facing, for example, adding identifiers for people (ORCIDs) or organizations (RORs). In these projects, answers have denominators that are the number of connectors (people or organizations). These are measures of connectivity rather than completeness. Figure 2 shows a simple connectivity example for a resource with two authors. Connectivity is the number of identifiers over the total number of possible identifiers.
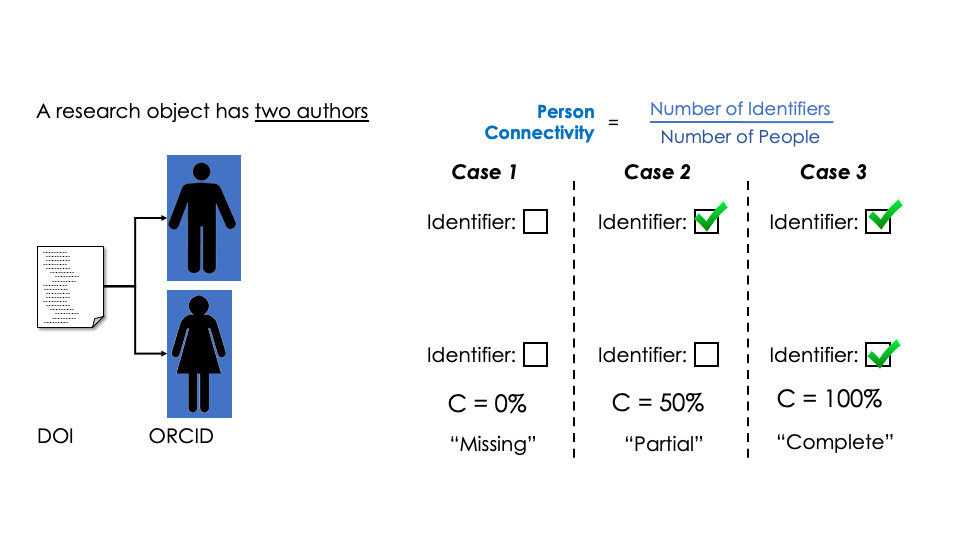
Figure 2. Connectivity is the actual number of identifiers / number of possible identifiers. In this case a resource has two authors. Connectivity can be zero if neither have identifiers, 50% if one has an identifier, and 100% if both have identifiers.
Connectivity results for GigaScience Press, number 1 on the list of member bright spots, are available here. The member number (member:23445) is used to select GigaScience and other inputs are set to select the content type (Journal Article) and the era (all time) and the number of records to sample (default = 200 which includes the whole repository in this case). The results are described below along with screen shots from the tool.
Any metadata item that can have an identifier has connectivity. This tool considers seven items in the Identifier Connectivity section. For example, the first bar addresses the question “How many identifiers do authors have?”. The GigaScience metadata includes 1,454 distinct authors that occur 1,928 times in the metadata and 1,316 of those occurrences (68%) include identifiers.
This example illustrates the difference between completeness and connectivity. There are 191 journal articles in this repository and all of them include identifiers for at least one author, so the ORCID score in the Participation Reports is 100%. The connectivity (1,316 / 1,928) is 68%, indicating that an opportunity exists for improving author identifier connectivity. Note that the Participation Report number is already 100% so it will not ever increase, even as over 600 ORCIDs are added to the metadata. Connectivity makes that typically invisible improvement work visible by using the total number of authors that could have identifiers as the target in the calculation.
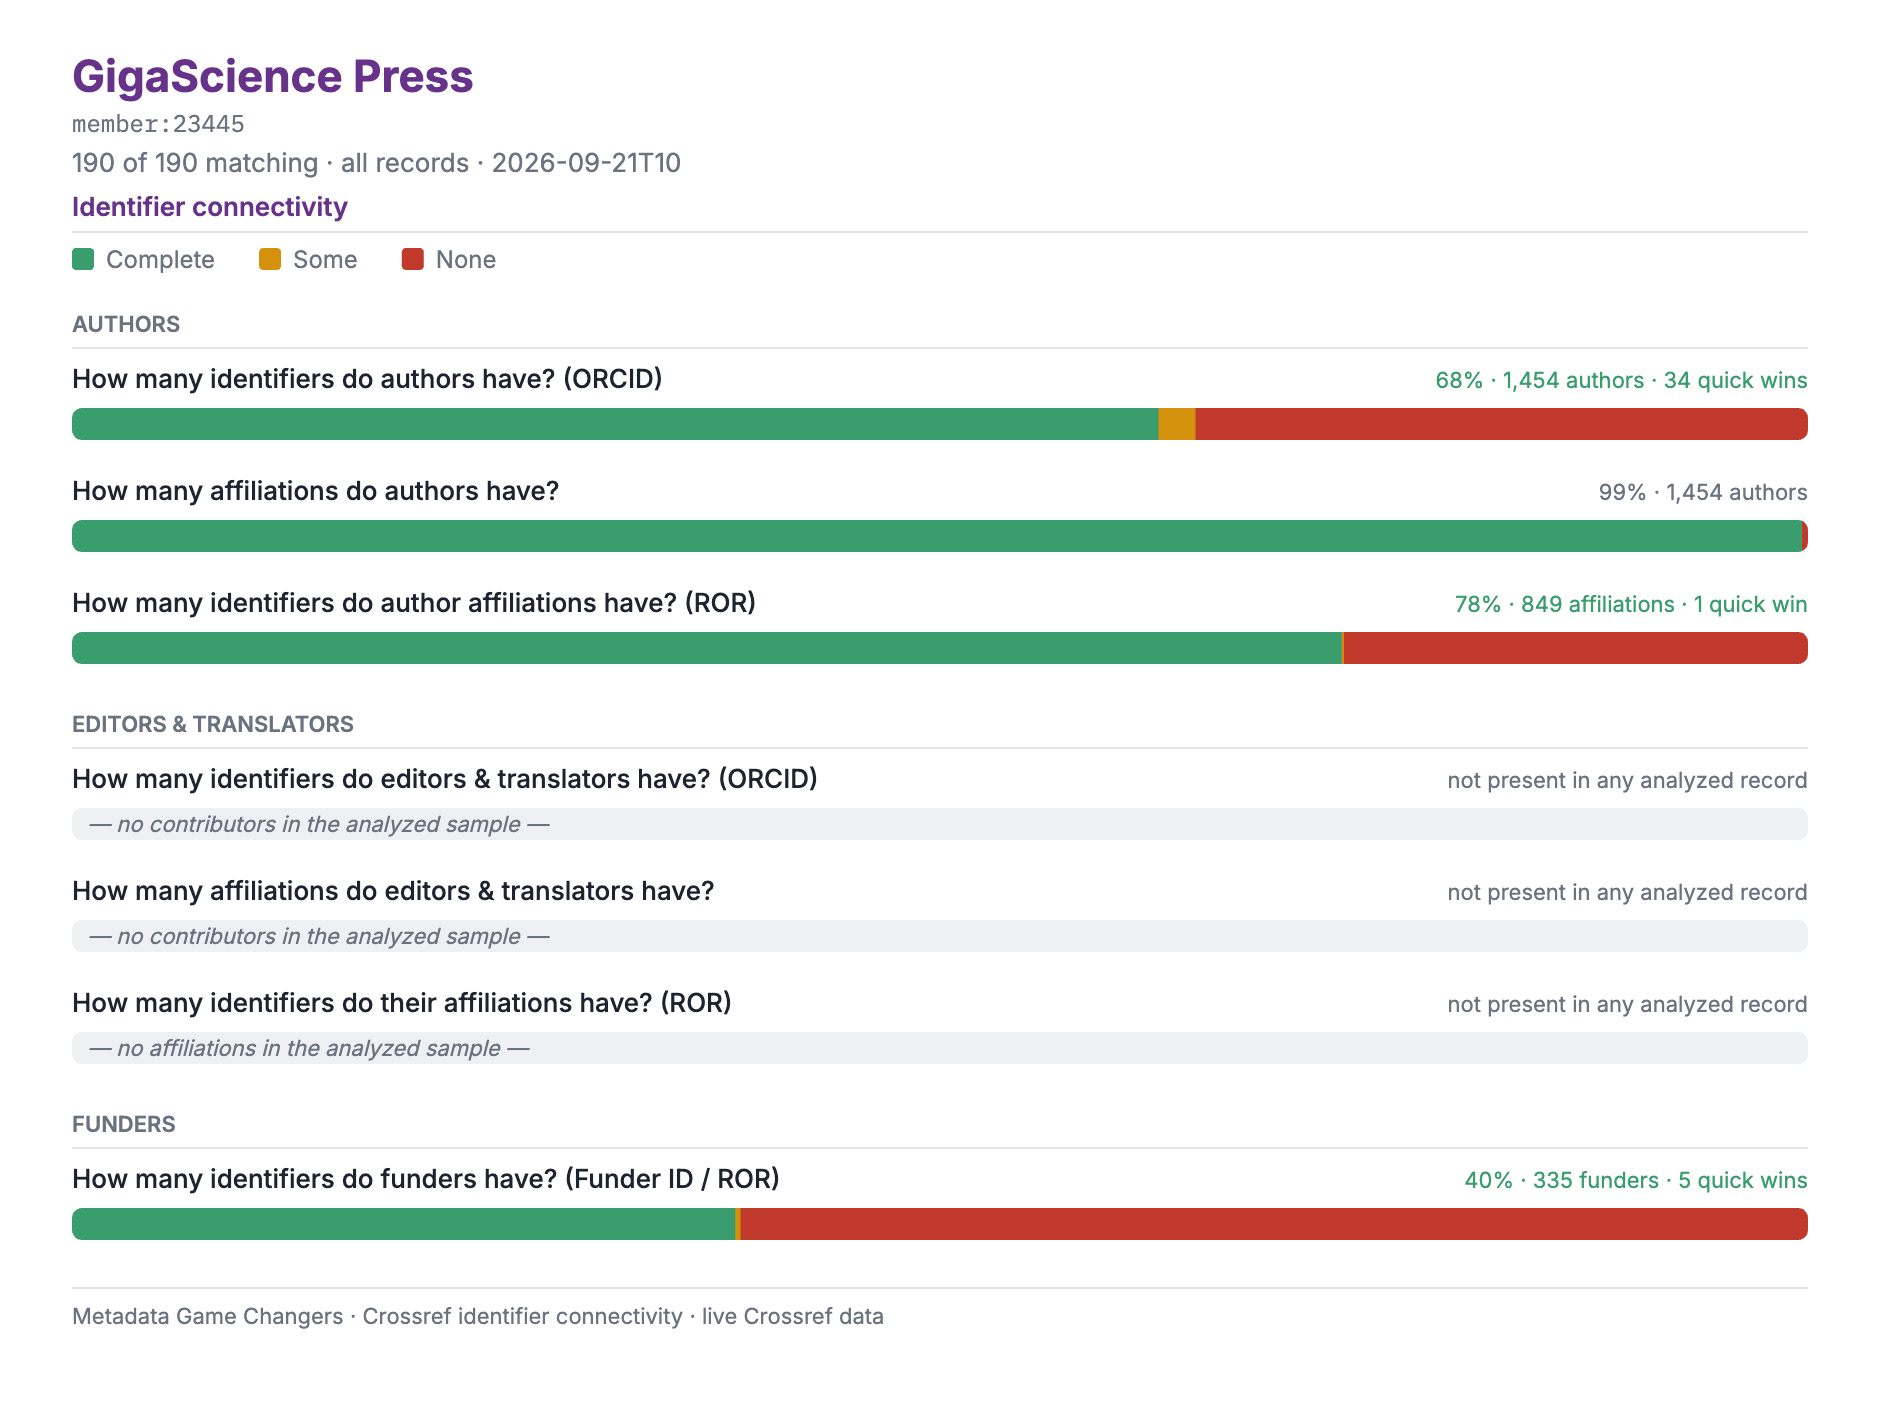
Figure 3. Connectivity results for GigaScience Press (member:23445) journal-articles, all time. No editors or translators are included in the member metadata, so no results are shown for those items. See text for descriptions of the results.
There are three possible author-oriented answers to connectivity questions and the colors in the bar show those answers. An author that occurs multiple times in the metadata can have identifiers in all occurrences (green), identifiers in some occurrences (yellow), and identifiers in no occurrences (red). The second group, authors with some identifiers, are special. Their identifiers already exist in some records, but not all, i.e. they are known. These authors are called quick wins – their connectivity can be increased using ORCIDs you already know, avoiding the challenges of searching for ORCIDs. In this repository there are 34 quick wins for ORCIDs.
Clicking on the bar lists authors along with the number of occurrences, the number identified (a link to the metadata), and the number of DOIs to fix (a link to the metadata). The quick wins (yellow background) are listed first, followed by those with no identifiers (red background), and then those with all identifiers (green background). Scroll down in the tool to see these.
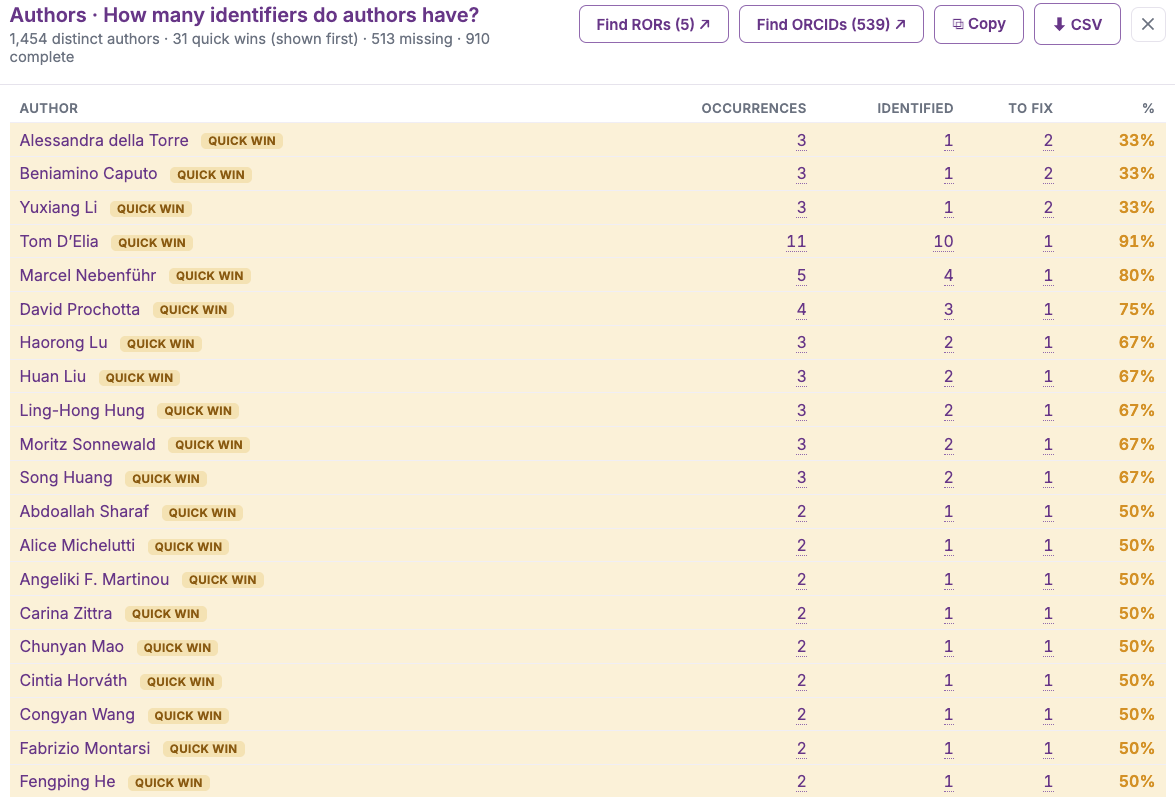
Figure 4. Author list displayed by clicking the first bar in the Identifier connectivity section. Quick wins are listed first with the number of times they occur, the number of times they have identifiers, and the DOIs to fix by adding identifiers. All of these numbers are links to the DOIs that then link to landing pages and metadata records so you can check the sources. The missing and complete groups are listed below the quick wins.
Of course, the goal is to add quick win identifiers to the metadata and to find identifiers for the missing group. The “Find RORs” and “Find ORCIDS” buttons at the top of the list link to ROR and ORCID searches for the quick wins and missing groups. The search results (Figure 5) include the RORs (or ORCIDs) that are found, along with information on how they are found. The rows are colored by confidence for quick looks: green rows are likely successes, typically one match found, red indicates no ROR found, and yellow means somewhere in between. Clicking the RESULTS number shows the top ten results from the search along with a check for the result chosen by the ror.org algorithm.
The list also includes a VALID check box that is true in the CSV file saved with the button above the list when checked and false if not checked. This facilitates on using the results of human checks in tools for improving the metadata by updating the identifiers.
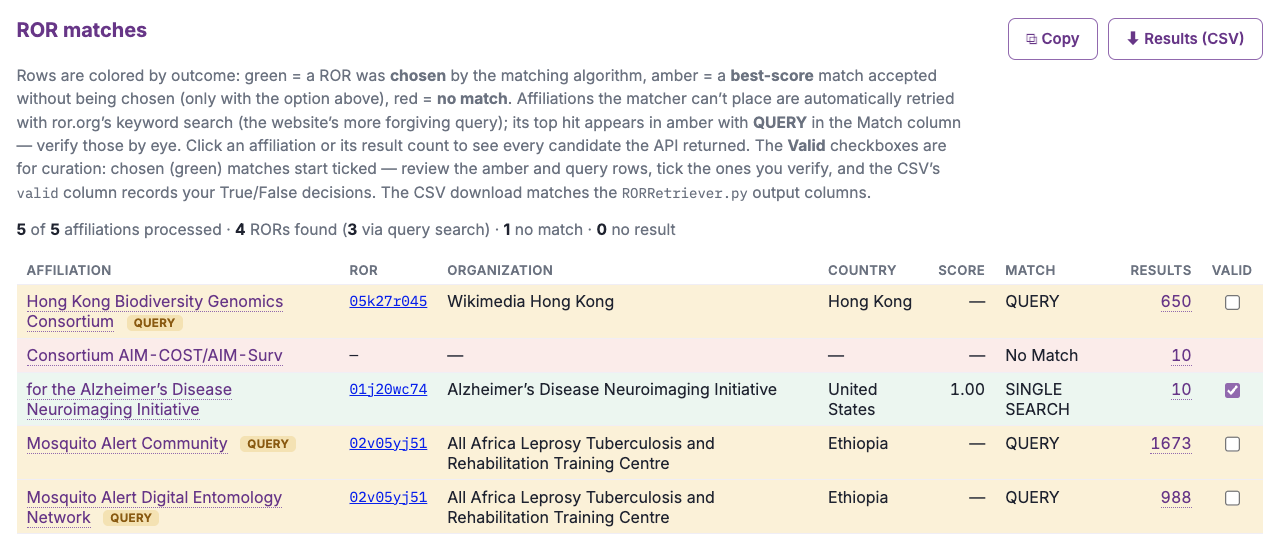
Figure 5. Results of ROR search from ror.org. Columns include search string (Affiliation), ROR (if found), Organization, Country, Xcore (from ror.org), Match type, Results (link to top ten result), and Valid (saved to CSV as True or False). Rows are colored: green (single match), yellow (multiple match or query type), red (no match found).
Other Questions
Authors in Crossref metadata can also include affiliations which may or may not exist, and affiliated organizations can have, or not have, identifiers, so authors include two other connectivity questions. It is interesting to note that these two questions are also included in the GigaScience Participation Reports with values of 100% and 99% while the connectivity is 99% and 78%. Another example of important information above and beyond the Participation Reports provided by the connectivity analysis.
The same three author questions can be applied to other kinds of contributors like editors or translators (and maybe others to come). Finally, funders can also have identifiers in the Crossref metadata schema so the same connectivity data are shown in the last bar. All of these questions provide informative additions to several elements in the Participation Reports.
Metadata Evolution
The goal of these tools is to improve the Crossref metadata by adding identifiers and other elements important for discovery, connection, and understanding of member resources. As members do the, typically invisible, work to make this evolution happen, it is critical to be able to measure the evolution as a means for demonstrating success. The Participation Reports support this capability by providing data for two periods: current (current and two previous years) and backfile (before current). The Metadata Evolution section of the tool displays both periods at once to make it easier to compare the two time periods and identify improvements.
The connectivity tool displays the evolution data extracted from the Participation Reports in two ways: as a table with data for all time period / content type combinations and as a radar plot with current and backfile data. Hopefully these two presentations serve both text and visual learners (like me). Highlights from the Table display for journal articles from the American Physical Society (APS) are shown in Table 2 and large increases are clear across the board.
| Item / Era | backfile | current | Difference |
|---|---|---|---|
| Records | 746,423 | 68,640 | |
| abstracts | 0% | 33% | 33% |
| orcids | 12% | 93% | 81% |
| funders | 24% | 87% | 63% |
| award_numbers | 20% | 79% | 60% |
| affiliations | 1% | 93% | 92% |
| ror_ids | 0% | 79% | 79% |
| affiliation_ror_ids | 0% | 79% | 79% |
| update_policies | 17% | 100% | 83% |
The radar plot for APS is shown in Figure 6. Participation Reports items are arranged around the edge of the plot with completeness going from 0% in the center to 100% at the edge. The current period is shown as light purple with the backfile shown as grey shading with dashed boundaries.
The backfile is characterized by sharp peaks in completeness for references, licenses, and similarity which do not change much during the current period. In contrast, many of the other items, listed in Table 2 show high completeness, i.e., near the edges of the plot. The large empty areas between the two sets reflect the increases shown in Table 2 and the great work APS has done to improve their recent metadata.
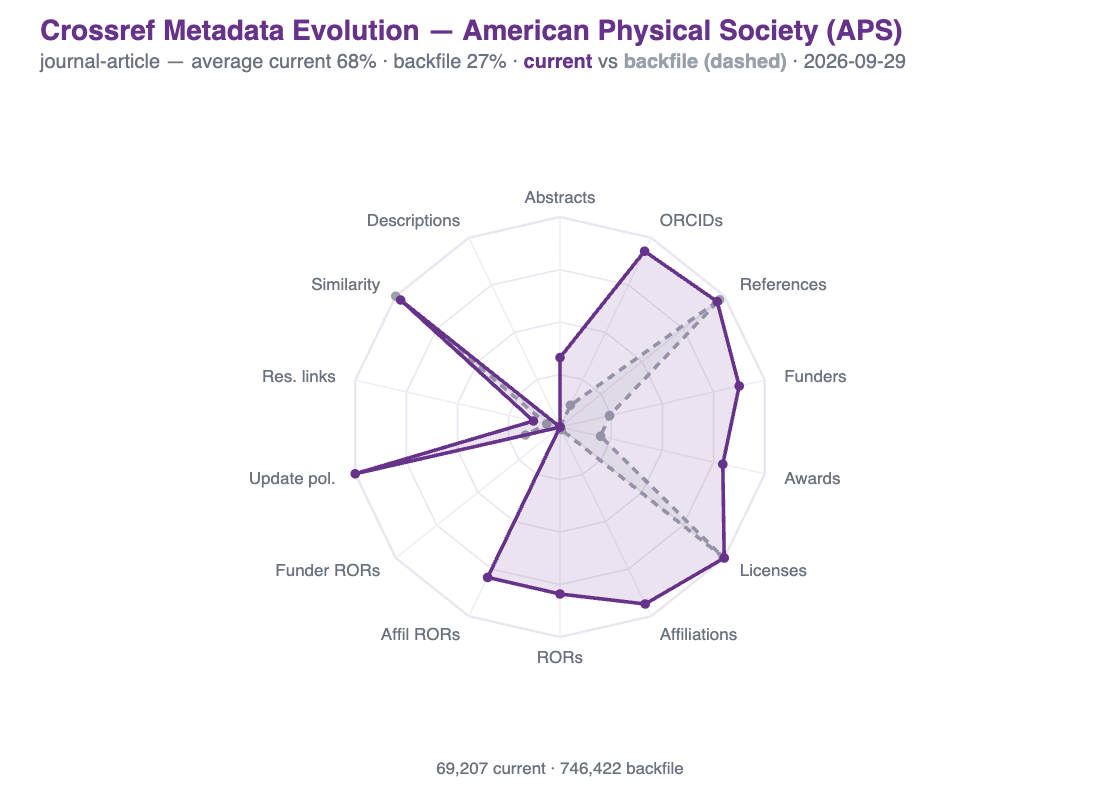
Figure 6. Radar plot comparing Participation Report data for records from the American Physical Society (APS), member 16. Participation Report items are arranged around the edge of the plot and completeness increases from 0% at the center to 100% on the edge. Two time periods are shown: current is light purple shading, backfile is grey with a dashed border.
The evolution of metadata reflected in a difference in Participation Reports during the two time periods introduces a second criteria for identifying bright spots, i.e., members with large increases in the Participation Report data. The members with current – backfile average >= 40%, i.e., the change bright spots, are listed in Table 3. The American Physical Society (APS), shown above, has the largest increase.
| ID | Member | current | backfile | all | cur-back |
|---|---|---|---|---|---|
| 16 | American Physical Society (APS) | 71% | 7% | 13% | 63% |
| 11587 | Instituto Colombiano del Petroleo | 63% | 4% | 7% | 58% |
| 4527 | The Korean Society of Remote Sensing | 58% | 0% | 21% | 58% |
| 51020 | Association of Polish Surveyors | 100% | 44% | 46% | 56% |
| 285 | Optica Publishing Group | 67% | 14% | 19% | 53% |
| 39746 | Beewolf Press Limited | 57% | 5% | 33% | 52% |
| 21103 | Instituto Nacional de Cancerologia | 54% | 4% | 7% | 50% |
| 11176 | National Institute of Telecommunications | 58% | 8% | 13% | 49% |
| 28884 | Asociacion Colombiana de Hematologia y Oncologia | 53% | 5% | 13% | 48% |
| 55703 | Jagua Publication | 48% | 0% | 46% | 48% |
| 2580 | AOSIS | 50% | 3% | 9% | 47% |
| 16197 | Fundacion Universitaria de Ciencias de la Salud | 53% | 7% | 12% | 46% |
| 56747 | Individual Entrepreneur Grigus Igor Mykhailovych | 47% | 1% | 33% | 46% |
| 12374 | Facultad de Letras y Ciencias Humanas, Universidad Nacional Mayor de San Marcos | 51% | 7% | 11% | 45% |
| 17333 | Society of Psychoceramics | 61% | 17% | 42% | 44% |
| 9719 | Instituto Tecnologico Metropolitano (ITM) | 54% | 11% | 19% | 42% |
| 235 | American Society for Microbiology | 63% | 22% | 24% | 42% |
| 5946 | Korean Society for Stem Cell Research | 59% | 17% | 25% | 41% |
| 57159 | ANO “Publishing House of Scientific Chemical Journals” | 46% | 6% | 23% | 41% |
| 54631 | Isabela State University | 41% | 0% | 39% | 41% |
| 7913 | Federacion Colombiana de Obstetricia y Ginecologia | 42% | 1% | 2% | 41% |
| 28404 | Colegio Oficial de Enfermeria de Malaga | 46% | 5% | 32% | 40% |
| 2086 | Beilstein Institut | 50% | 11% | 16% | 40% |
| 3145 | Copernicus GmbH | 53% | 13% | 20% | 40% |
| 22319 | Universidad de Cundinamarca | 51% | 11% | 17% | 40% |
The final section of the connectivity tools shows matches between entity names recognized using fuzzy matching. This approach can be very helpful, but it can also have some challenges, so this section is advisory. It can help identify cases where two different people or organizations have the same identifier or where a single person or organization has multiple identifiers. It can find the same sort of red flags for affiliations, funders, or rights statements. Once again, this is advisory information that may, or may not, be useful in all cases.
Conclusions
Complete metadata are critical for supporting discovery and understanding of all kinds of research resources. We have demonstrated some tools designed to help researchers and repository managers explore various aspects of DataCite metadata to facilitate improvement and, equally important, to recognize progress and share successes with institutional management or other repositories. DataCite and Crossref are two dialects of the universal documentation language, so they share many metadata elements. This made it possible to apply the ideas and capabilities developed for DataCite to Crossref repositories.
We introduce several freely available tools for Crossref repositories here. They build on the completeness ideas implemented for many years as Crossref Participation Reports by mapping metadata elements to FAIR Use Cases for Text, Identifiers, and Connections which are similar to the DataCite use cases with the same names.
We also build on the Participation Reports by displaying the results in a way that facilitates comparison between current and backfile periods with the goal of making it easier to identify and compare improvements in metadata completeness over time.
Finally, we extend the Participation Reports by supporting the measurement of connectivity developed several years ago. Connectivity is the number of items that have identifiers / the number of items that can have identifiers. This is fundamentally different from measures of completeness and it provides details for any metadata item that can have identifiers (authors, contributors, funders, licenses, …).
Other authors have explored Crossref metadata in similar ways (Varma 2025) and compared Crossref and OpenAlex metadata (Hartley Belmar 2025). Both of these provide interesting perspectives and, where they are comparable, the results are generally consistent with those presented here that are based on the same data, i.e. Participation Reports.
The concept of connectivity with calculations based on counts of specific connectors presented here is new. It typically indicates that there are opportunities to add many identifiers to these metadata even if the Participation Reports report 100%, i.e. every DOI has at least one identifier.
Bright spots are repositories that create, publish, and sometimes share more complete metadata. They can be recognized in many ways as demonstrated with DataCite in many blogs. Here we find two sets of Crossref bright spots using Participation Report data: 1) repositories that have outstanding metadata over their entire existence and 2) repositories that have outstanding improvements in their metadata over the last several years. These repositories serve as inspiration for the Crossref community by demonstrating that both of these goals can be achieved. It is a pleasure to recognize them and to celebrate their successes far and wide.
The Crossref tools presented here build on well understood capabilities in a new environment. They are prototypes at this point so comments, questions, and suggestions are welcome.
Data Availability
The Crossref Participation Report data are available for all members at https://doi.org/10.5281/zenodo.22925234.
References
Habermann, T. (2019a). Metadata Evolution - CrossRef Participation Reports. Front Matter. https://doi.org/10.59350/b0ctp-heh14
Habermann, T. (2019b). Metadata Evolution - Metadata Completeness, Agility, and Collection Size. Front Matter. https://doi.org/10.59350/5a12z-dq192
Habermann, T. (2021). Improving Domain Repository Connectivity: Closing the Circle. Front Matter. https://doi.org/10.59350/fjg8d-txx45
Habermann, T. (2026). Metadata Completeness [Computer software]. Metadata Game Changers (United States). https://doi.org/10.60872/METADATACOMPLETENESS
Habermann, T. and Robinson E. (2025). DataCite bright spots – Repositories, Consortia, and Improvements. Front Matter. https://doi.org/10.59350/v2may-69s52
Heath, C. and Heath, D., (2010). Switch: How to Change Things When Change Is Hard, Crown Currency, https://heathbrothers.com/books/switch/.
Marsh, D., Schroder, D.G., Dearden, K., Sternin, J., Sternin, M., 2004. The Power of Positive Deviance, BMJ, https://doi.org/10.1136/bmj.329.7475.1177.
Stoll, L. (2024). Re-introducing Participation Reports to encourage best practices in open metadata. Crossref. https://doi.org/10.64000/wxjpp-20570
Tolwinska, A., & Meddings, K. (2018). 3,2,1… it’s “lift-off” for Participation Reports. Crossref. https://doi.org/10.64000/h00dz-jw569