
YourOrganization@DataCite
/Several recent papers have described challenges involved in searching for research objects authored by researchers from an institution (Johnston et al. 2024, Gee 2026, Kirsch and Wink 2026). The challenges are significant and I do not deal with them here. Instead, I provide a tool for exploring how metadata for institutional outputs varies across different data journeys (Leonelli, S., & Tempini 2020). It provides data that can help institutions improve their metadata across the entire landscape.
Metadata creation and sharing architectures include multiple layers and metadata moves between those layers along multiple journeys (Habermann 2020). Some journeys end at DataCite where metadata are deposited and a Digital Object Identifier (DOI) is returned. Researchers have many journeys to DataCite to choose from. They can work with their institutional repository, a domain repository, or one of many generalist repositories, each of which typically has a different interface requesting or requiring different metadata elements. Once metadata are in the system, they can experience other journeys prior to or following deposit that can enhance or degrade their content.
Institutions have little influence over which of these journeys researchers choose, or what input they consider when making those choices. In a perfect metadata world, they might consider completeness of the metadata that will permanently represent their work to the research community. Fortunately, DataCite metadata are open and available through a very flexible API, so we can compare the end products of the journeys.
We have recently developed a set of tools designed to help repository managers explore completeness, connectivity, and histories of their repositories. Today we are announcing an addition to that set for exploring where resources from a university of other organization are published and comparing completeness of metadata across those locations. It is free and available to all at https://bit.ly/OrganizationCompleteness. Enter an organization name or ROR into the box and press the explore button to see the results. Figure 1 shows the tool homepage with the ROR for Wageningen University & Research (https://ror.org/04qw24q55) selected.
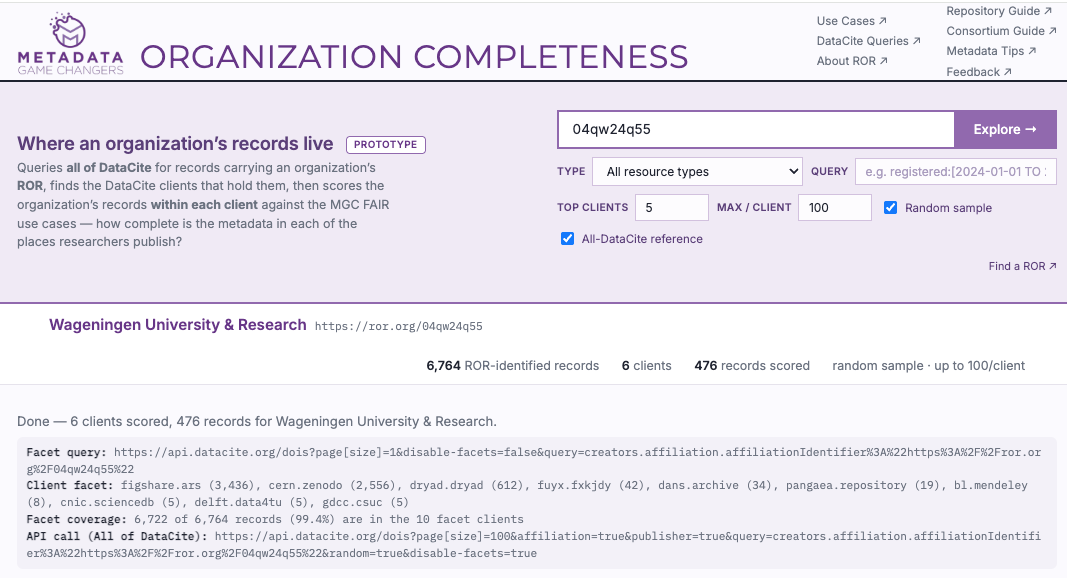
Figure 1. Input and query descriptions from the Organization Completeness tool. Primary input is the name or ROR of the organization to be explored. Optional input includes the number of clients and the maximum number of records / client. Output includes the DataCite API query for the facets and the output of the client facet that shows the ten clients with the most records with the input ROR and how many records they hold.
Step 1 – Know the ROR
Author affiliations can be written in many ways and include many kinds of ancillary information, making text searches for affiliations difficult and inconsistent. Also, many organization names overlap, increasing the inconsistency and potential for errors. The Research Organization Registry has been developed to address this problem by associating unique and persistent identifiers with organizations. These identifiers can be used to overcome some of the problems with text searches.
Adoption of RORs across DataCite is an on-going process so, finding “all” research outputs must combine text searches for organization names and ROR searches (Kirsch and Wink 2026, Habermann and Riley 2026). In this work, we are interested in high level comparisons as a first step, so we use ROR searches which are precise but can miss some results, i.e. have low recall. This also means that all retrieved records include RORs, so the metadata completeness results may be biased high.
Step 2. The Client Facet
The DataCite API includes the option to list common values for some metadata elements in records retrieved by any API call. These data were included in all results until recently when disabling facets became the default to improve performance on queries where facets are not useful.
We can use facets to find the most common repositories in a ROR search with a query like:
https://api.datacite.org/dois?page[size]=1&disable-facets=false&query=creators.affiliation.affiliationIdentifier:[ROR]
which retrieves one record and facets for all matching records. The clients facet gives the ten most common clients that include the ROR along with the number of records in each.
The facet query and the client results are shown in the shaded bar below the repository description. In this case, the query and the result are shown here. Note that the facet query is encoded – you don’t have to worry about that when you input the ROR.
Client facet: figshare.ars (3,436), cern.zenodo (2,556), dryad.dryad (612), fuyx.fxkjdy (42), dans.archive (34), pangaea.repository (19), bl.mendeley (8), cnic.sciencedb (5), delft.data4tu (5), gdcc.csuc (5)
The client facet shows the ten most common repositories in the results and the number of records they hold. The results are similar to many for universities, most of the resources are in the large generalist repositories: Figshare, Zenodo, and Dryad. The repository fuyx.fxkjdy is Yoda@WUR, a relatively young repository from the Wageningen University.
The Facet Coverage, i.e. the total number of records in the clients / the total number of records in the repository is given in the shaded text so that users know how many of the total records are included in the ten facet repositories. Like in this case, where the coverage is 99.4%, this number is typically close to 100%.
I will refer to the repositories that are holding records from the organization as clients as they are referred to in the facets and to differentiate them from the repository of the organization being studied.
Step 3: Query the Clients
Now we know where resources from the target organization are held, so we can query those clients for records that include the organization ROR. The interface (Figure 1) gives us two options here: the number of clients (default = 5) and the number of samples selected randomly from each client (default = 100). The defaults provide a reasonably quick look that can be tuned if desired to cover more of the clients or to sample more events from each.
Gathering the results can take a bit of time but like in all our tools, a series of Metadata Tips are displayed while you wait. Use the Metadata Tips link in the top bar to see the tips for all tools.
The tool finishes the queries by running the ROR query across all of DataCite to provide an overview of organizational completeness for all clients, including those not included in the facets, as a baseline for comparisons.
Step 4: Results
As the client queries are done, the results are displayed as a line plot and a table. The results can also be viewed as a grid of radar plots (Figure 2) for details, or as a movie which can be clicked from frame to frame for visual comparisons. Use the View selector to switch between these.
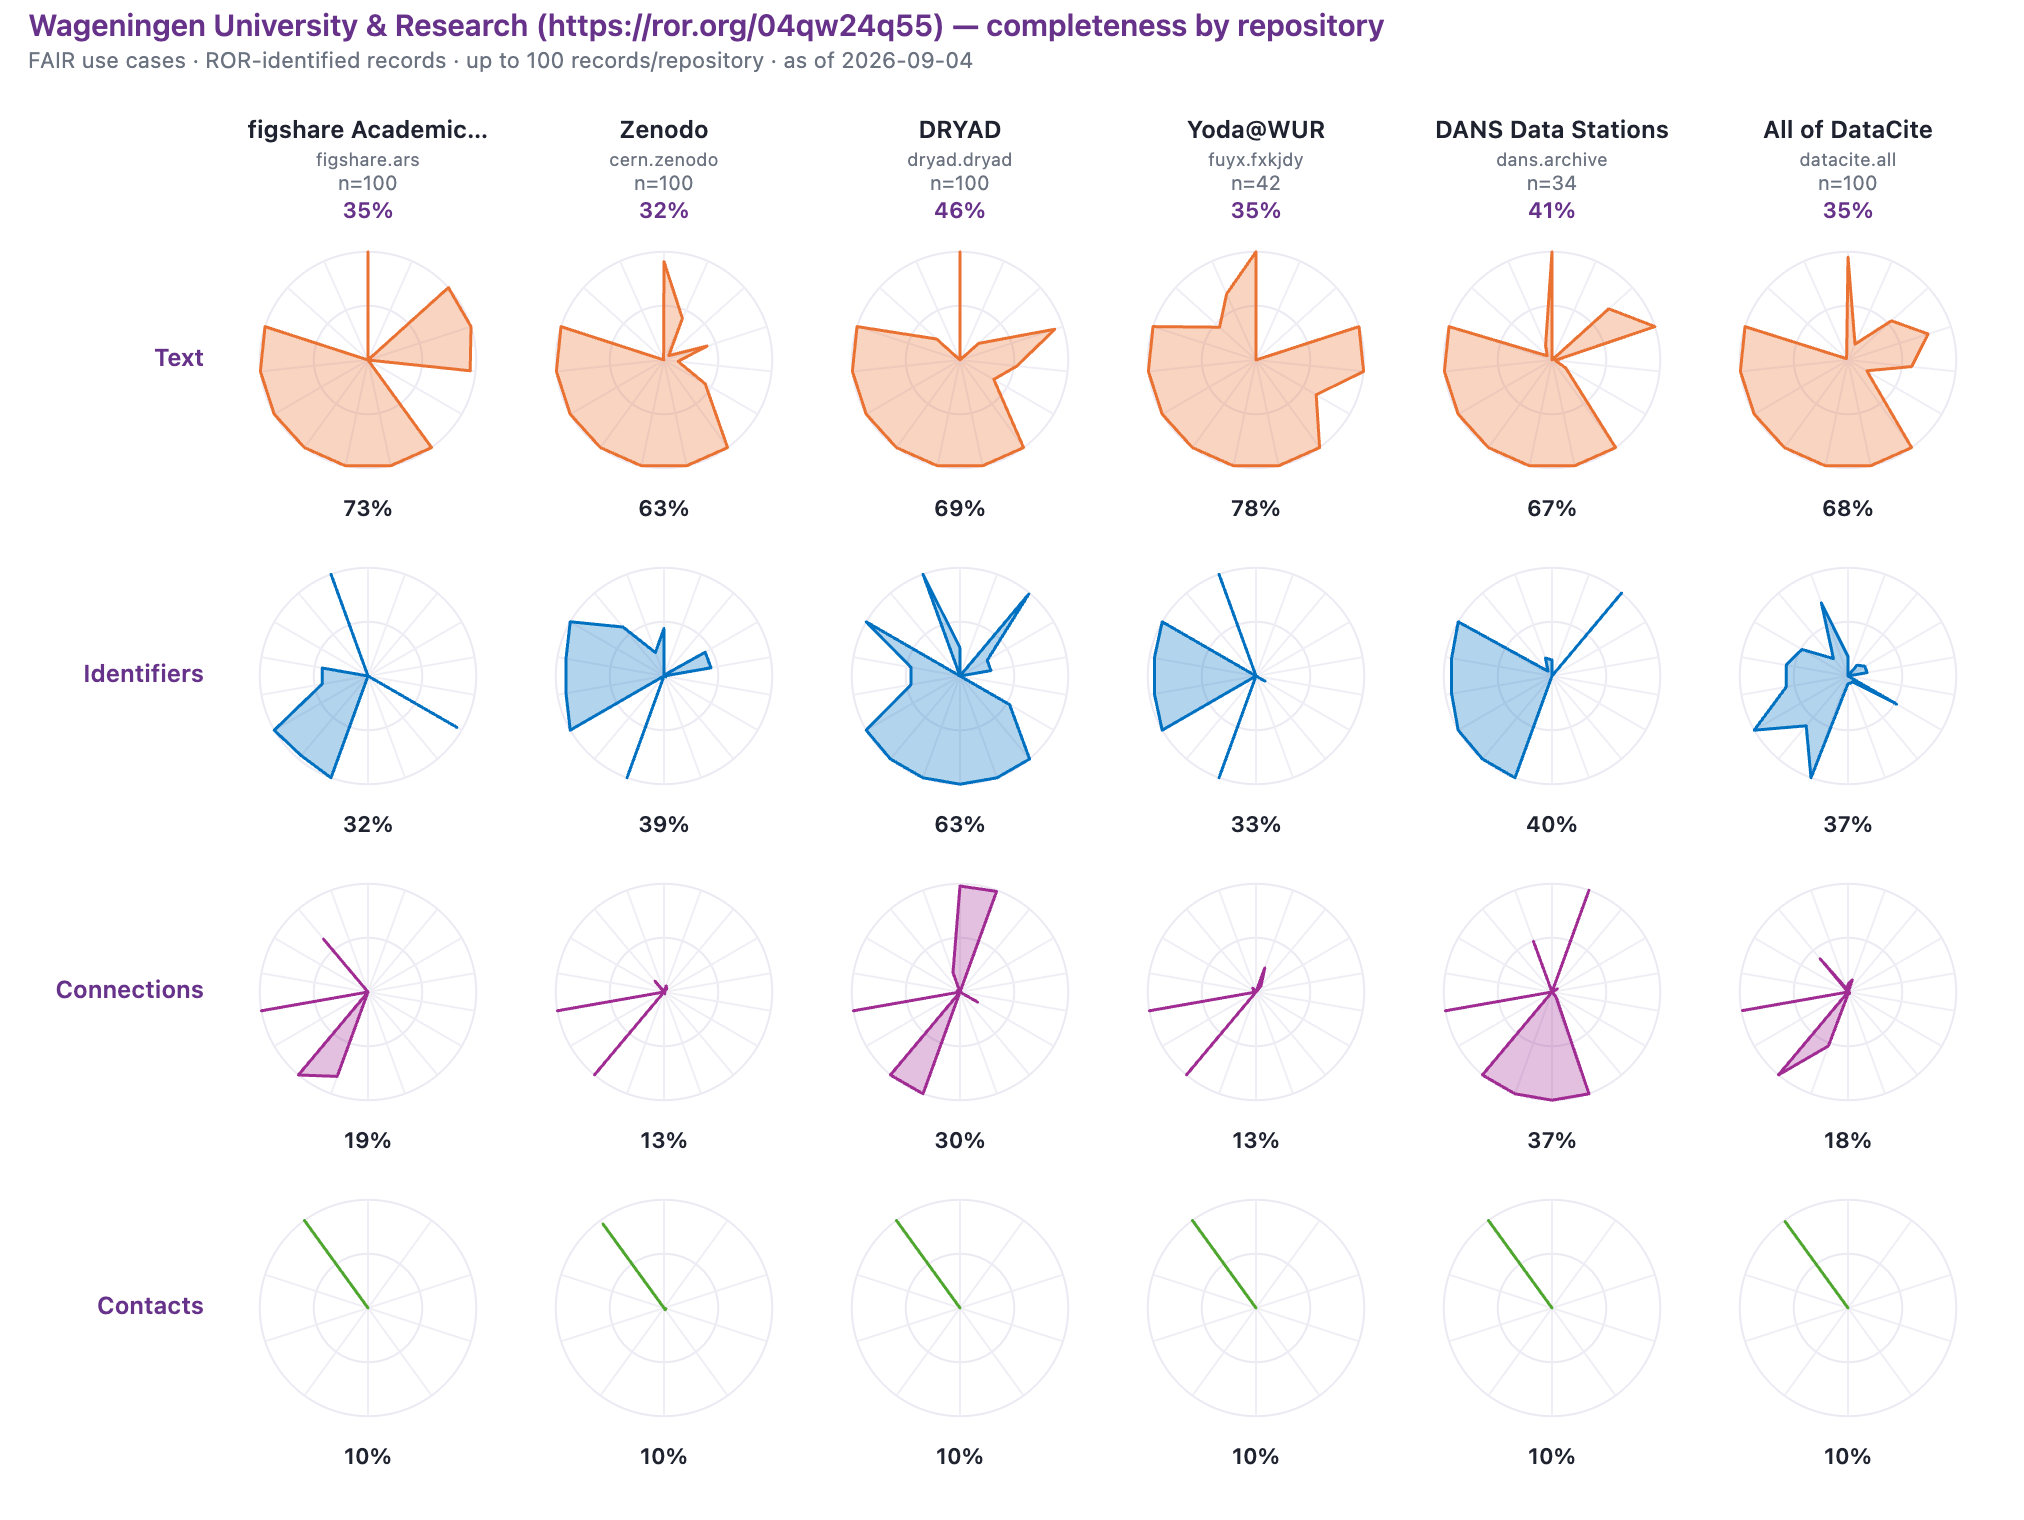
Figure 2. Radar plot grid of FAIR Use Case completeness (rows) for five clients and all of DataCite (columns). Radial scales are completeness from 0% in the center to 100% on the edge. Completeness for each use case is below the radar plots and overall completeness is in column titles. Note that the first three use cases have clear bright spots. Metadata concepts in each use case are given in Use Cases or can be seen using the Completeness links in each row of the data table.
The Use Cases selector above the plot allows selection of one of four groups of use cases for comparing metadata across the clients: FAIR (default), Project, SHARE, and Extras. Details of these use cases and the mappings to the DataCite elements they include are available from the Use Cases link in the top bar.
The FAIR Use Cases cover sixty-one DataCite metadata elements relevant to the FAIR principles (Text, Identifiers, Connections, and Contacts). Each use case is a row in the radar grid and each client is a column. The scores for each use case are given in the table and below each radar plot and the overall scores are at the top of each repository column. These use cases have been used extensively across all DataCite repositories and have a large corpus of results (Habermann and Robinson 2025). The average of total completeness across 3500+ repositories is 24%.
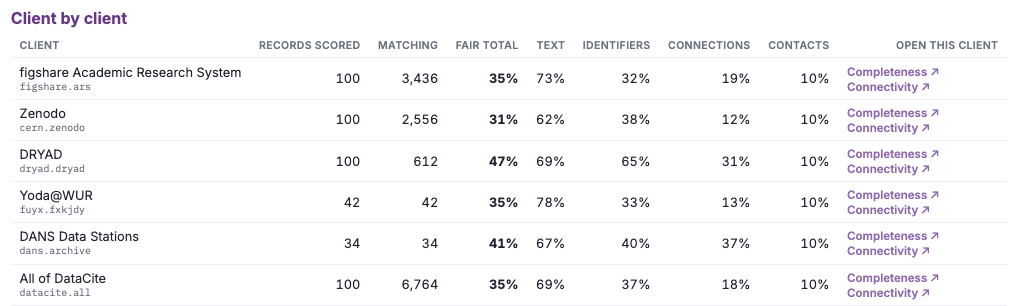
Figure 3. Table showing completeness values for each use case and client. The Matching column shows the number of records that include the organization ROR for each client. Links on the right connect to completeness and connectivity links for each sample (samples are shared with those tools).
The table shows the results for each repository and use case being displayed in the plots. The records scored column shows the number of records selected randomly from each client, controlled by the max/client selector just below the ROR selector. The total number of records matched is also shown in case you want to increase the sample size.
The scores for each client and use case are listed next. In this case, all the clients show completeness well above the DataCite average. The Text Use Case is the most complete because it includes the six required DataCite elements. The Identifier Use Case includes ORCIDs for creators and RORs for affiliations, funders and publishers. Dryad is outstanding for with identifiers being nearly two times as complete as the other clients.
Step 5. Details
The plots and the small samples provide quick overviews of the completeness across the clients. The Table includes links to the Completeness and Connectivity tools for detailed looks at organization metadata in each client. These links share the metadata sampled for the client comparisons so you can increase the MAX/CLIENT to see larger samples.
The completeness view shows details for each use case as a radar plot (with labels!) and a list of the elements included in the use case with their completeness shown as a bar. Clicking the concept names shows the distribution of values for the concept from the metadata. Any of the fourteen use cases can be viewed using the selectors above the radar plots.
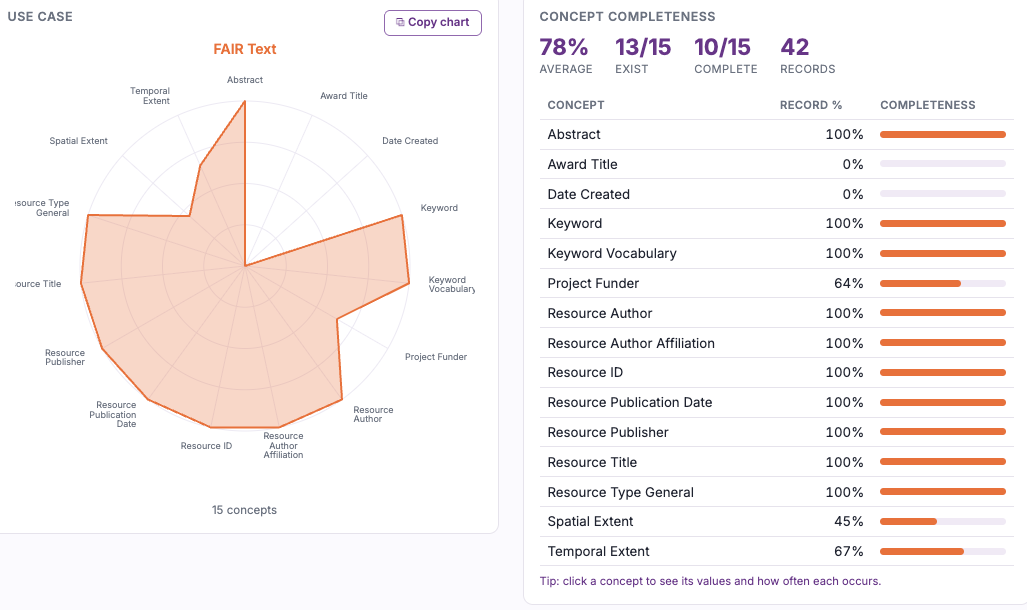
Figure 4. Text completeness details for the Yoda@WUR institutional repository. The table shows metadata elements included in this use case along with their completeness. Clicking the element names gives the distribution of values for that element in the metadata sample.
The connectivity tool answers very different question about the metadata by exploring the portion of people or organizations that could have identifiers that have them, i.e. the number of creators with identifiers / the number of creators (Habermann 2025). The tool addresses several variations on this question:
How many identifiers do creators/contributors have?
How many affiliations do creators/contributors have?
How many identifiers do creator/contributor affiliations have?
How many identifiers do funders have?
How many identifiers do publishers have?
How many URIs do rights have?
How many identifiers do rights have?
Figure 5 shows three aspects of creator connectivity: identifiers, affiliations, and affiliation identifiers in Dryad. Figure 2 shows that Dryad is doing very well across the entire Identifier Use Case with 67% completeness. Figure 5 shows that when measuring completeness of specific identifiers, Dryad has done a great job with affiliations and RORs and can improve coverage for ORCIDs in this sample.

Figure 5. Connectivity results for a sample of 100 records from Dryad. The bars show % creators with all identifiers (green), some identifiers (yellow quick wins), and no identifiers (red). Clicking the bars show details and include ROR and ORCID searches.
Discussion
Researchers have many options for sharing data in the current open science environment and tracking organizational research across multiple locations can be difficult. Some of this difficulty can be managed by using RORs to search for organizations in DataCite metadata. The question then becomes: what researchers are using the organization ROR in their metadata?
We introduce the Organization Completeness tool that uses the ROR approach to identify resources, and then measures metadata completeness to address the question: how do metadata differ across the variety of locations where researchers are registering datasets? Hopefully this approach can help organizations understand their metadata landscape and help them work with researchers to improve metadata completeness everywhere.
We use Wageningen University & Research (https://ror.org/ 04qw24q55) as an example of the tool capabilities. Their landscape is representative of many we have explored. Most of the resources (~99%) are registered in large generalist repositories, e.g. Figshare, Zenodo, and Dryad. There is also an institutional repository, relatively new in this case, and several others that include other resources.
Of the large repositories, Dryad has the most complete metadata overall, particularly for Identifiers and for Connections. Dryad has a strong commitment to active curation of deposited data and it seems to pay off in more complete metadata.
This tool is new so there is no doubt room for improvement. Please contact us if you have questions or suggestions.
References
Gee, B. M. (2026). The hunt for research data: Development of an open-source workflow for tracking institutionally-affiliated research data publications. Journal of eScience Librarianship, 15(1). https://doi.org/10.7191/jeslib.1170
Habermann, T. (2022). Metadata Life Cycle: Mountain or Superhighway? Front Matter. https://doi.org/10.59350/86jd5-wpv70
Habermann, T. (2025). University and College Connectivity @ DataCite. Front Matter. https://doi.org/10.59350/w95qm-ann38
Habermann, T., & Riley, J. (2025). How ROR IDs Help the EarthScope Consortium Track Organizational Partnerships. Research Organization Registry (ROR). https://doi.org/10.71938/T5BN-BM23
Habermann, T. and Robinson E. (2025). DataCite Bright Spots – Repositories, Consortia, and Improvements. Front Matter. https://doi.org/10.59350/v2may-69s52
Johnston, L. R., Hofelich Mohr, A., Herndon, J., Taylor, S., Carlson, J. R., Ge, L., Moore, J., Petters, J., Kozlowski, W., & Hudson Vitale, C. (2024). Seek and you may (not) find: A multi-institutional analysis of where research data are shared. PLOS ONE, 19(4), e0302426. https://doi.org/10.1371/journal.pone.0302426
Kirsch, D.R. & Wink, I. (2026). Assessing Researcher Data Sharing Practices Using Publicly Available Dataset Metadata: A Reproducible Workflow for Institutional Stakeholders. Journal of Librarianship and Scholarly Communication, 14(1), eP22913. https://doi.org/10.31274/jlsc.22913
Leonelli, S., & Tempini, N. (Eds.). (2020). Data Journeys in the Sciences. Springer International Publishing. https://doi.org/10.1007/978-3-030-37177-7