
Tracking a Data Sharing Journey
/Ted Habermann, Metadata Game Changers
Cite this blog as Habermann, T. (2026). Tracking a Data Sharing Journey. Front Matter. https://doi.org/10.59350/jn7qt-yvb17
We recently shared some repository journeys with snapshots from our Repository Tools that documented steps along the way. Since that blog was published, I discovered a set of journeys that are currently in progress. Helping repositories capture their journeys in real time is one of our goals. I start telling this story here as it unfolds.
I have been documenting DataCite repository FAIRness to find more complete repositories, i.e. bright spots, for some time, so I have histories for many repositories. This dataset shares some of those histories and compares FAIRness measured during January 2026, in the Total column, and May 2025, in the 202505 column, and the difference (2026 – 2025), in the change column. The repositories with the largest changes are interesting targets. For example, the Materials Cloud (ethz.marvel) repository increased from 17% to 31%, putting it in the top ten. This large increase is the first indicator that something interesting was going on in this repository.
Metrics Viewer
The Repository Tools suite includes the Metrics Watch tool that provides the capability to automatically measure completeness for a repository or a set of repositories without installing or running any software locally. Table 1 compares Materials Cloud completeness for May 2025 and January 2026 for the four FAIR use cases: Text, Identifiers, Connections, and Contacts (see use case mappings to DataCite). The number of records doubled between these two times and all four of the use cases showed large increases in completeness.
The Metrics Viewer reads and displays data from Metrics Watch. Figure 1 makes the metadata improvements visible as more complete plots on the right, the run during January 2026. These radar plots show completeness for 61 metadata elements in four use cases (radar plot keys). Elements that are complete (100%) reach the outer edge of the plots. The number of records in each run is just below the date and we can see this increased from 1,234 to 2,473 between the two runs. Completeness for each use case is shown below each plot. The total completeness is shown just below the number of records. It increased from 17% to 31%.
Completeness in the Text use case increases from 47% to 60% between the two runs driven mostly by increases in the % of records with abstracts, at the top of the plot, and creator affiliations at the bottom right. The Metadata Completeness tool shows the current details for each use case and element.
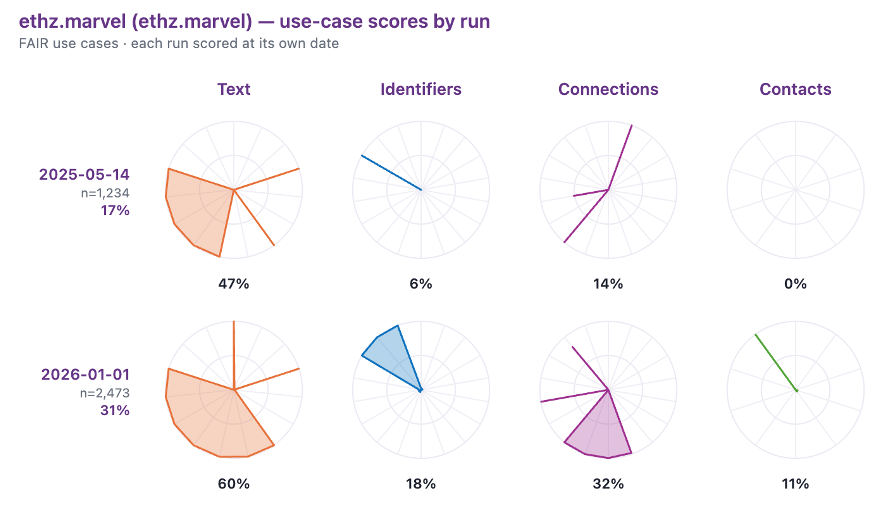
Figure 1. Use case completeness comparison for May 2025 and January 2026. Each row shows four FAIR use cases for a time: 2025-05-14 on the top and 2026-01-01 on the bottom. The toal, in the titles, and All use case scores, under each plot, show large increases and number of records, e.g. n=1,234, doubles. The plot keys are at https://bit.ly/FAIRUseCasesForDataCite
Repository History
It is important to keep in mind that these runs are both full repository runs, not sub-sets, so metadata improved across the whole repository between May and January. This can be explored further by viewing the Repository History for the repository.
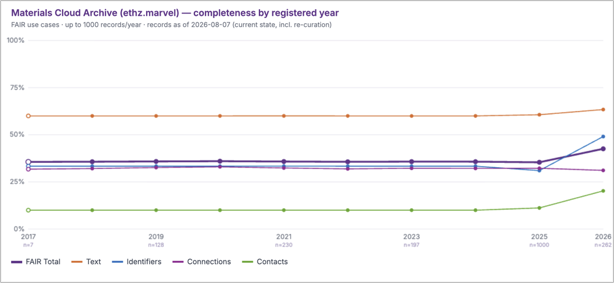
Figure 2. The Materials Cloud repository history by year registered shows the current completeness for all four use cases and records registered (i.e. created) every year. The consistency of completeness throughout the period does not show the incomplete metadata observed during May 2025. Also, note increases during 2026.
This tool samples the repository and computes completeness every year, see n=number on the x-axis. The increase in the size of the repository that we know occurred between May 2025 and January 2026 is clear here as the jump to 500 records during 2025 (there was a limit of 500 on the yearly samples), but the outstanding characteristic of this history is the remarkable consistency of the completeness. The numbers were the same every year between 2017 and 2024: 60%, 33%, 32%, and 10%. The incompleteness that we know covered the entire repository before May 2025 is gone. This indicates that what happened during 2025 was a complete re-curation of the entire repository increasing completeness across all previous years.
The x-axis on Figure 2 is the year that DOIs were created, i.e. registered. We can switch to last updated year for a different view (Figure 3). This shows that the last updates were during 2026. The entire repository was updated between March and August 2026. Most of this activity (2,549 records) was during March but only 500 records were sampled during March for this plot, n = 500. This update again facilitated consistent completeness across the entire repository with small increases across the newer records, these are the increases seen in Figure 2 during 2026.
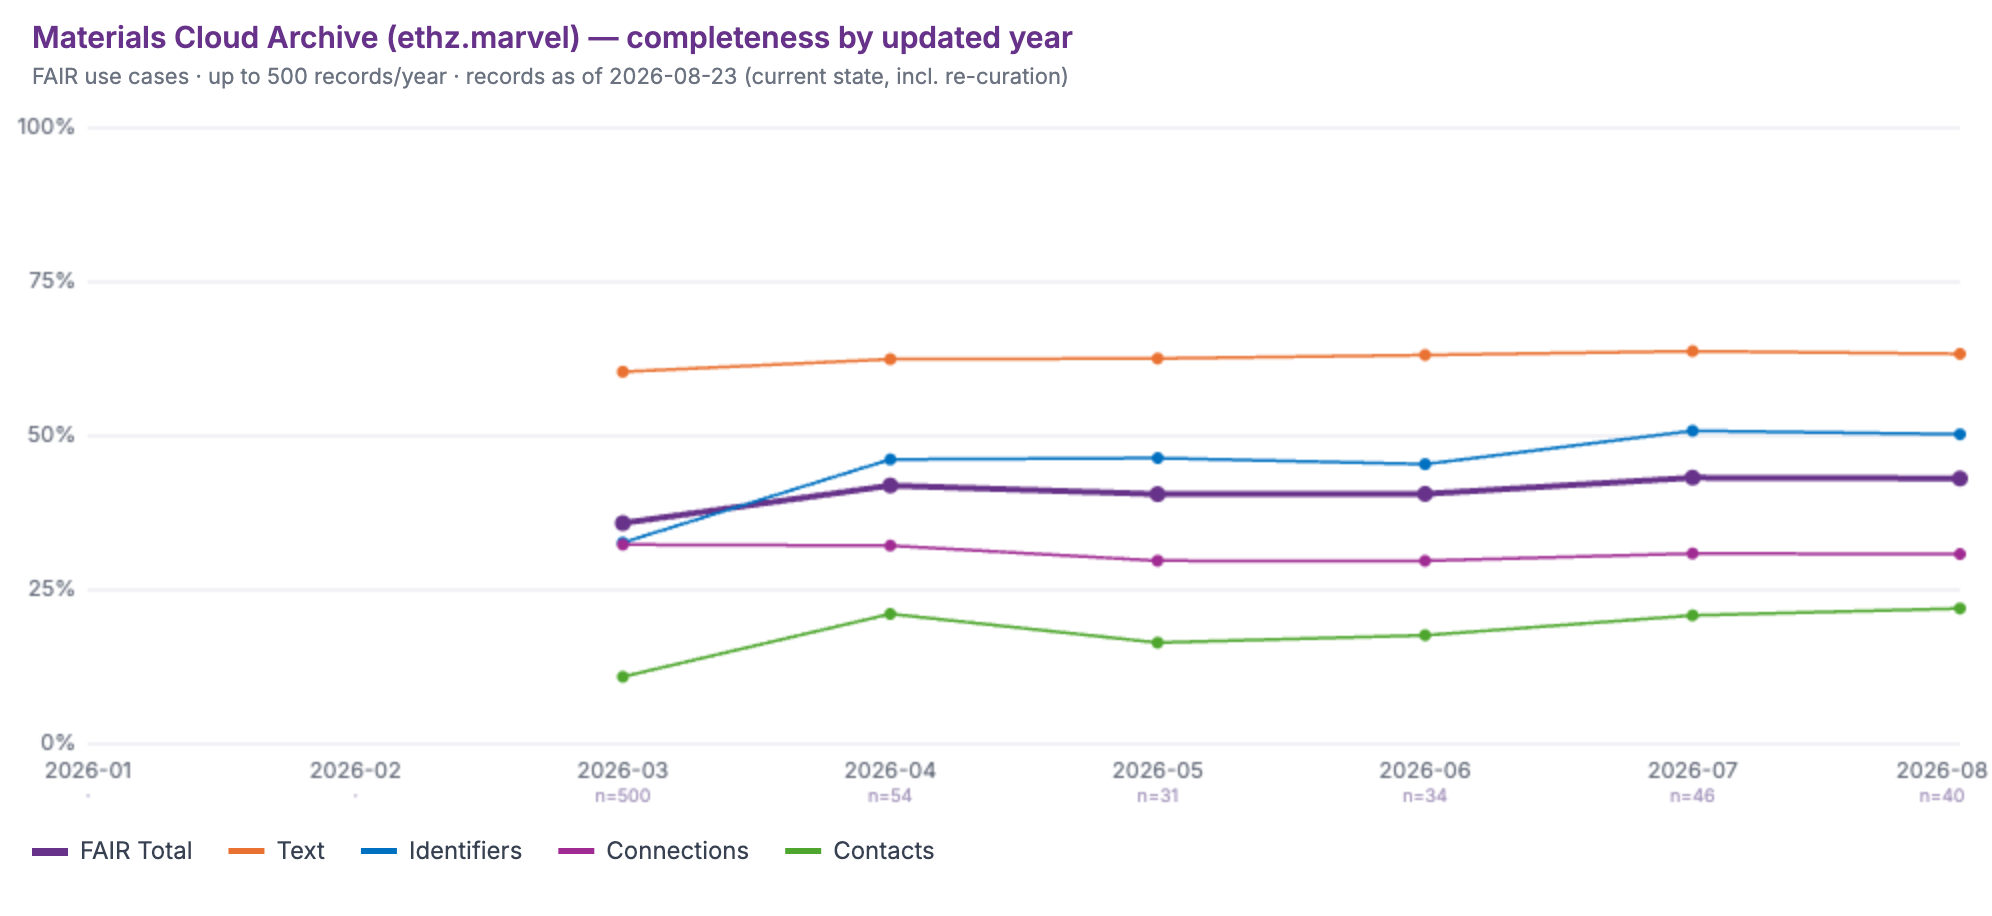
Figure 3. Completeness of updates to the repository made during the most recent six months. 2549 records were updated during March 2026 (only 500 were sampled here) and the sum of records updated during 2026 = all the records in the repository, so this was a second complete re-curation.
Repository Activity
The 2026 re-curation project resets all the updated dates in the metadata records, so the selection by updated dates misses the re-curation that we know occurred during 2025. The 2025 effort is recorded in the Repository Activity that shows metadata provenance using the DataCite Activity API. This tool shows the most recent 10,000 update events from over 57,000 made by the Materials Cloud (each event can change several properties, so the bars total more than the event count). Fortunately, this is enough to see both re-curation efforts that we have seen evidence of. The bars show almost 15,000 metadata properties updated during June 2025 and over 8,000 properties updated during March 2026.
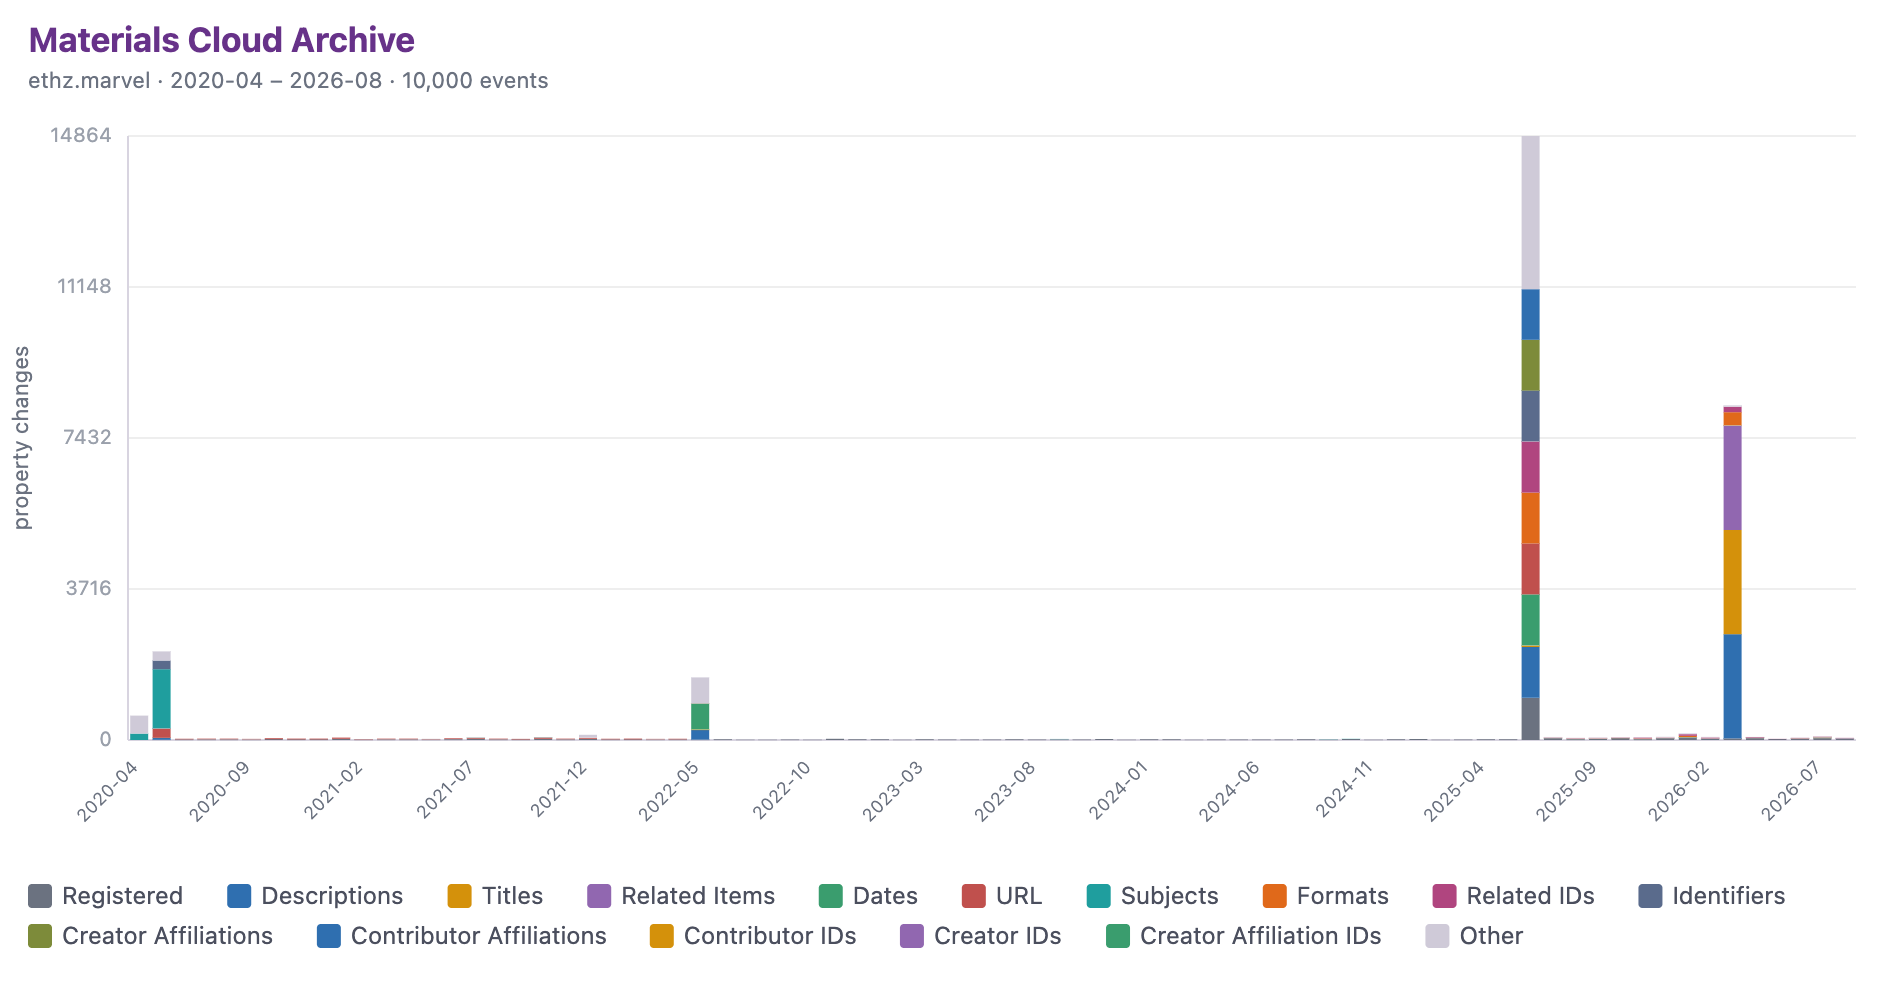
Figure 4. Repository Activity for the Materials Cloud showing two episodes of re-curation. The first, during 2025, was driven by the migration of the repository to the InvenioRDM Platform and the second was part of the interoperability project described in the text.
The colors in the bar chart indicate the properties that were changed and more details can be viewed by clicking on the bars themselves. The two re-curation projects focused on two different parts of the metadata records, a wide variety of elements during the first and mostly contributor metadata and creator IDs during the second.
Ground Truth
Once I reached this point in the story, I reached out to the Materials Cloud to get the ground truth: what had actually happened. Of course, they recognized both re-curation projects. The first, during June 2025, happened when they migrated their repository to InvenioRDM, the open-source repository platform developed at CERN and used at Zenodo and in many repositories all over the world. This migration explains the doubling in the number of records in the repository as InvenioRDM versions each record into a Version 1 and an umbrella DOI for all versions (like Zenodo). Record duplication on creation does not affect completeness. The second re-curation project was still going on when I contacted them during August 2026. It is part of an effort to enable interoperability across four repositories in the ETH domain: the Materials Cloud (ethz.marvel), the Paul Scherrer Institute Public Data Repository (ethz.psi), EnviDat (ethz.wsl), and Eawag Research and Data Management (eawag.rdm).
The interoperability project is a great example of a group of repositories working together to facilitate interoperability across the ETH Domain and to improve their metadata as a step in that direction. They developed shared guidelines for using DataCite metadata for scientific research data and each repository has been actively re-curating metadata using those guidelines. Their activity histories look similar to the Materials Cloud (PSI Public Data Repository, EnviDat, EAWAG Research Data Management) with many improvements made in all repositories since the beginning of 2025. Like the Materials Cloud case described above, each of these is its own journey towards improved interoperability.
Figure 5 shows the current state of FAIRness in the four repositories with total FAIRness varying between 30 and 48%. While all repositories are significantly above the overall DataCite average of 23%, opportunities for improvements, i.e. missing pie slices, remain. Good examples and lessons learned, i.e. bright spots, exist even within this small group for some of these. For example, the EnviDat repository has made significant progress on the identifiers use case (blue) and Materials Cloud and EnviDat have made progress on connections that other members of the group can emulate. For other opportunities, the repositories can find repositories outside of this group for ideas, examples and lessons learned.
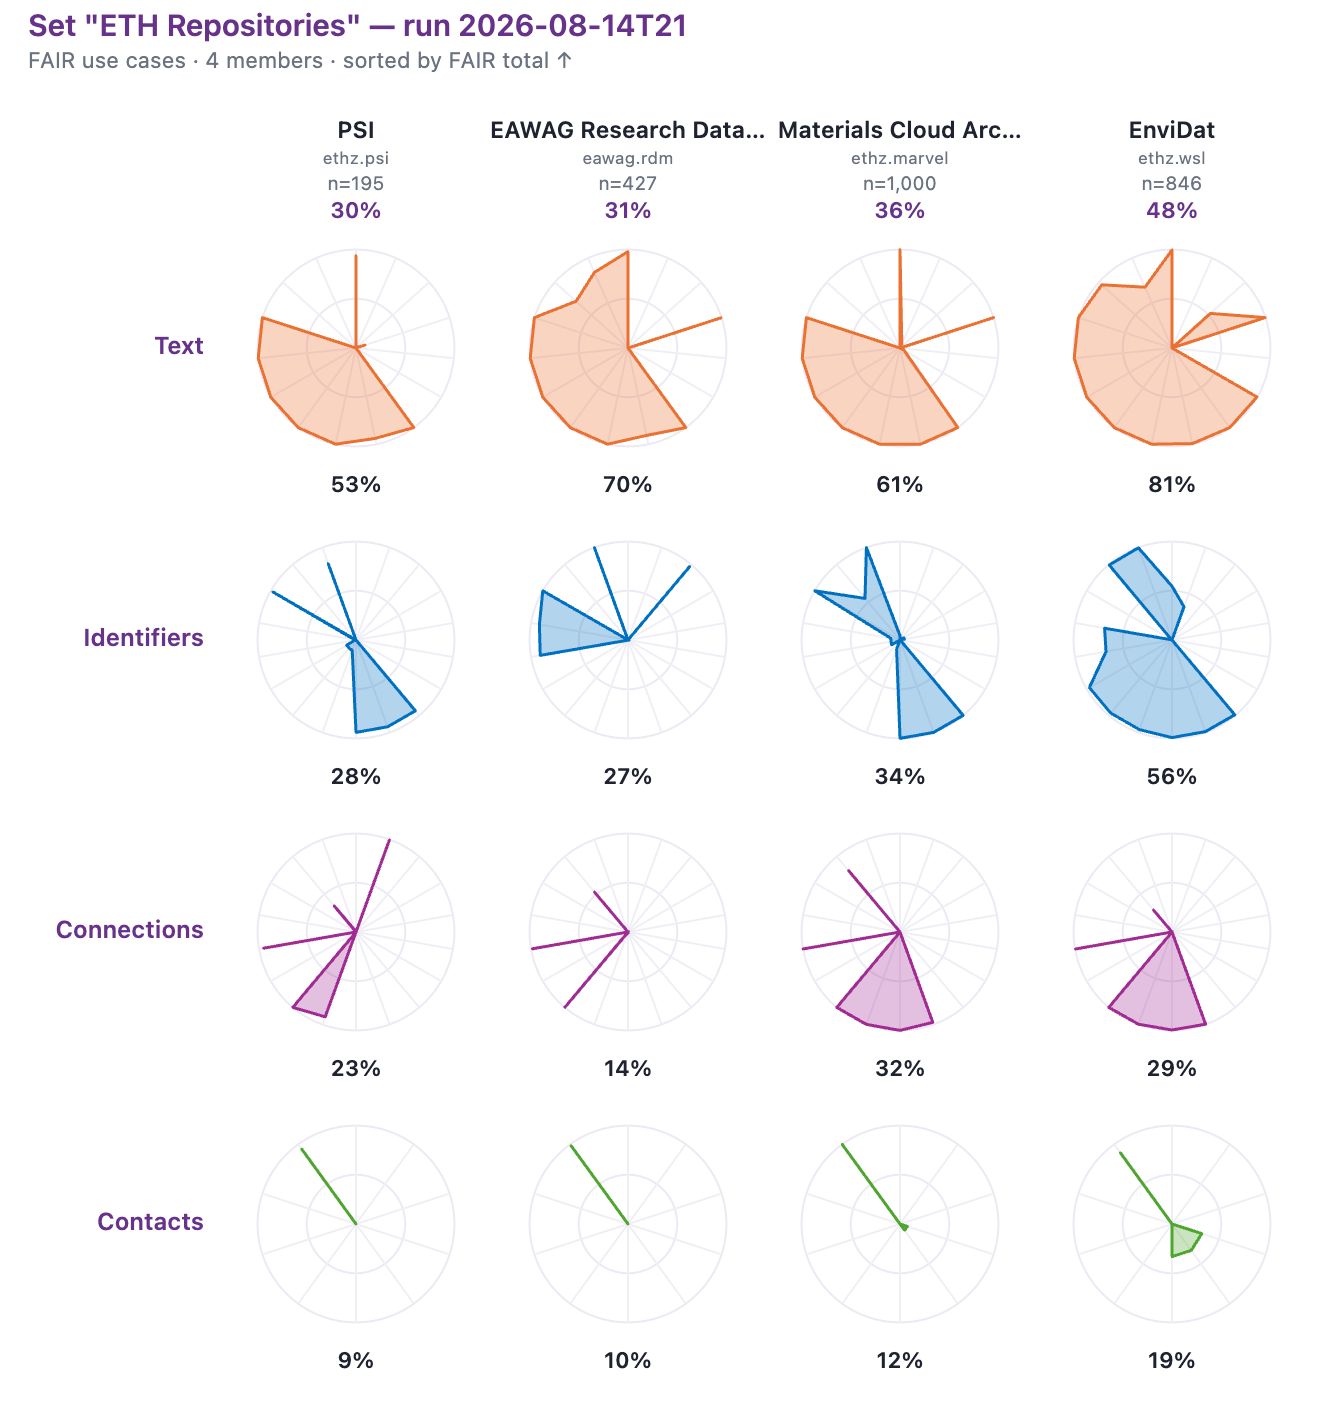
Figure 5. Current completeness for four use cases in the repositories involved in the interoperability improvement project. Samples included up to 1,000 records from each repository.
This project shares many of the goals of the NIH Generalist Repository Ecosystem Initiative (GREI) Project implemented on a more local scale. These ETH repositories are smaller, i.e. less than 1,000 records, and therefore, more agile than the very large repositories with millions of records included in GREI. Also, even though these are domain repositories, they understand the important interoperability role of the DataCite schema and are taking advantage of the broad range of interoperability metadata that the schema offers. Of course these opportunities are available to all DataCite members, but many repositories still focus on just the mandatory fields required to get DOIs.
It is interesting to note that I discovered this project because of a lucky choice to measure completeness across all DataCite repositories during May 2025. A month later, I would have missed the Materials Cloud re-curation. It is likely that I have missed similar projects across other DataCite repositories. If you know of similar platform migration or re-curation projects in your repository and need help documenting or getting credit for them, please let me know, as I would like to take a look and see if I can recognize them retrospectively. Also, this project demonstrates an important lesson learned: if you are about to embark on a similar journey, measure and document completeness as a baseline before you make improvements. Once those improvements are made, in this case by migrating to a new platform (InvenioRDM), the baseline before the improvements fades into history. Of course this makes it more difficult to document the hard work that went into the improvements and the benefits. The Metadata Completeness tool can be used to record your starting point before you begin or try the Metrics Watch to automatically keep a record of your progress without you developing or running software. Good luck whatever your project may be.