
Repository Journeys and Scrapbooks
/Ted Habermann and Erin Robinson, Metadata Game Changers
Introduction
Any complex and dynamic interconnected data system depends on combinations of organizations and people that collect and publish data, sources, queries, and tools. These combinations reflect different journeys between and through places where people are engaged in practices of data production, processing, distribution and use, termed Data Journeys by Bates et al., 2016. This concept has been applied across many disciplines (Leonelli and Tempini, 2020) and to the global research infrastructure (Habermann and Jones, 2025).
Repositories play many roles in data journeys, and, in fact, they experience journeys of their own with changes in management, staff, users, and technologies. We have created a set of tools built around pictures that record aspects of those journeys in attempts to describe and understand repository metadata evolution. Like scrapbooks, collections of these pictures tell repository stories. Several types of stories are described here.
We focus on DataCite metadata in this analysis which means that we are considering the portion of metadata that is shared by repositories into the global research infrastructure. Many times, changes in these metadata reflect changes in repository metadata sharing processes rather than metadata creation processes. Software that does the sharing is generally a small part of the repository software set so it may be amenable to change without broad impacts on repository systems.
We present three kinds of data journeys here: 1) a repository that changes processes to share new metadata from now forward, 2) a repository that shares new metadata content across its entire history, and 3) a repository that continuously updates the same set of shared elements. The pictures of these repositories are taken from our Repository Tools which are linked from the captions.
Biological and Chemical Oceanography Data Management Office (BCDMO)
BCODMO has been sharing metadata with DataCite since 2020. Figure 1 shows completeness of the metadata for four different FAIR use cases (Text, Identifiers, Connections, and Contacts) and all four use cases show very constant completeness between 2020 and 2025. There is a deviation (+~15%) for the Identifier use case (blue) during 2026.
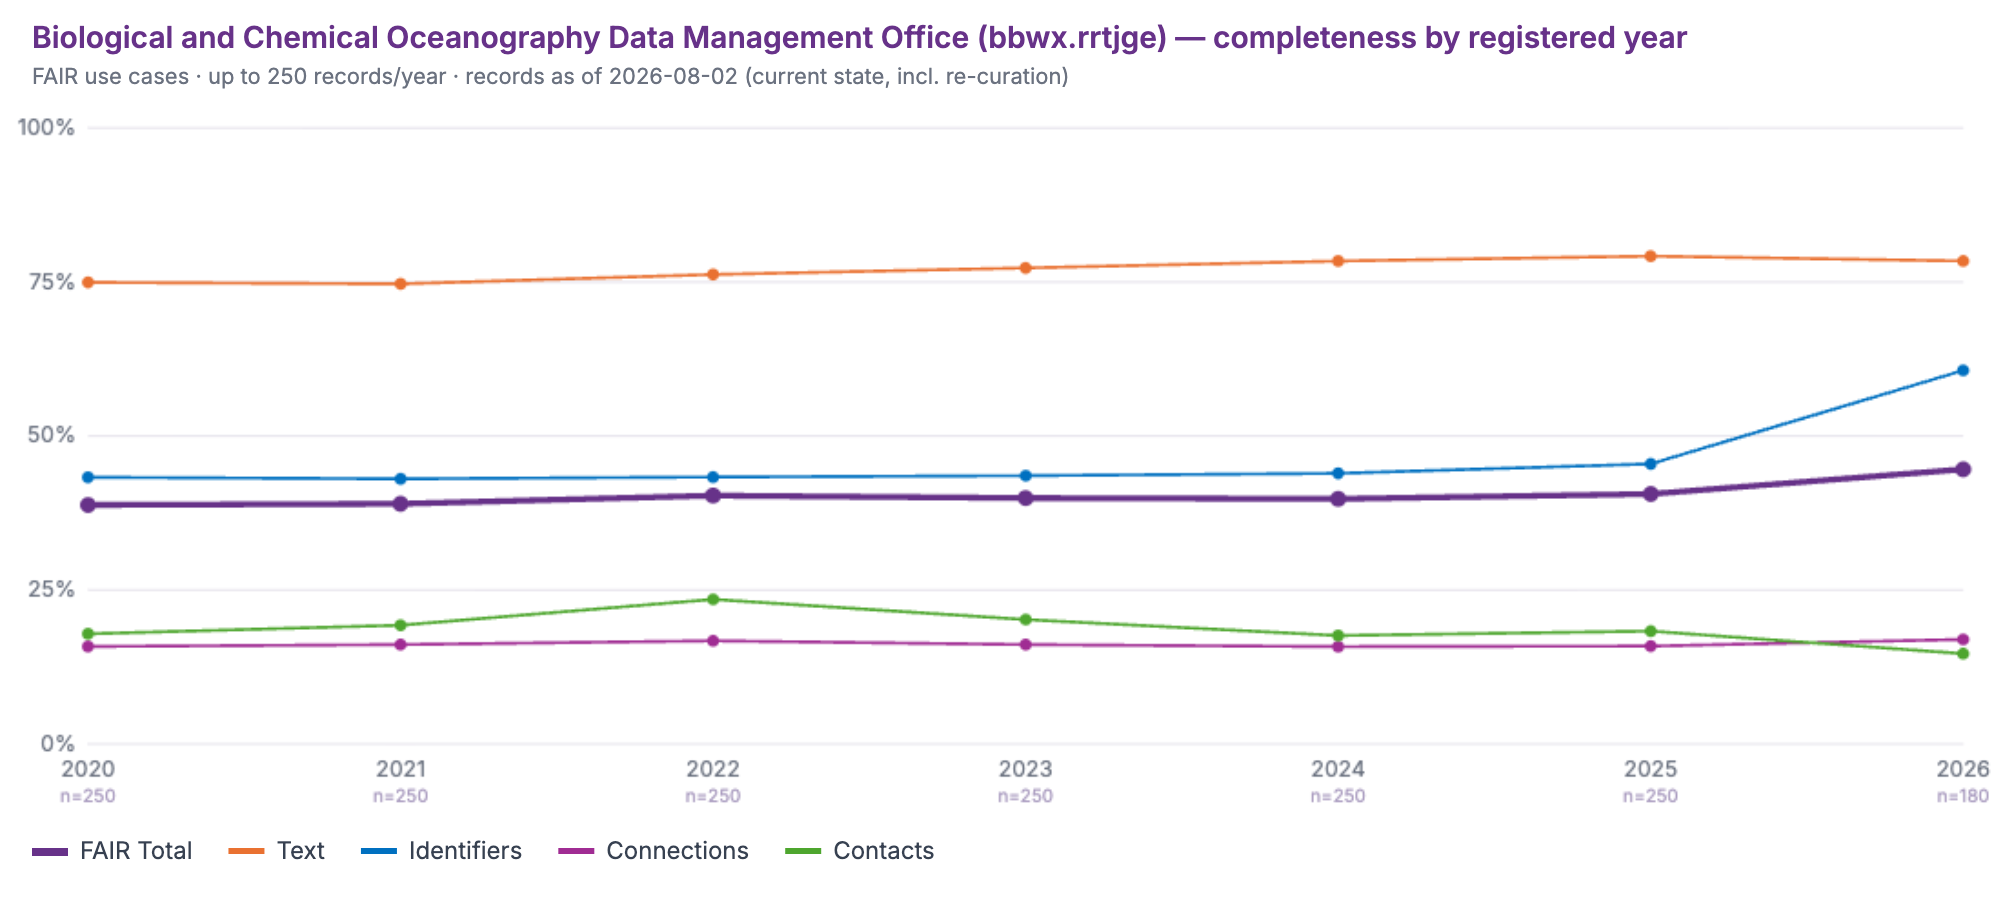
Figure 1. BCODMO yearly metadata completeness for four FAIR use cases since 2020. Note increase from ~44% to 61% for Identifiers (blue) during 2026. View this picture.
We can explore this change in more detail using a radar plot grid which shows yearly completeness for ~60 elements in four use cases (Figure 2). The consistency of the metadata prior to 2026 and the increase in the identifier use case (blue) during 2026 is clear. The detailed radar plot inset shows that the increase occurred for three elements related to Resource Author Affiliation IDs in the lower left part of the radar plot.
Figure 1. Yearly radar plots of completeness for four use cases (Text, Identifiers, Connections, and Contacts top to bottom). Note the consistency for all use cases prior to 2026 and the increase in the lower left quadrant of the identifier radar plot (blue) for 2026. The inset shows details of the 2026 identifier use case. Note that the increase is related to three elements with metadata related to Resource Author Affiliations. View this picture.
The change during 2026 reflects new sharing of affiliation identifiers by BCODMO. This could be a decision to create and share new content or simply a decision to start sharing existing content during 2026.
NSF Seismological Facility for the Advancement of Geoscience (SAGE)
The NSF Seismological Facility for the Advancement of Geoscience (SAGE) existed for many years as the Incorporated Research Institutes for Seismology (IRIS) and recently merged with the Geodetic Facility for the Advancement of Science (GAGE) to become the NSF National Geophysical Facility. It has a long history of sharing metadata with DataCite, and the FAIRness of metadata is very consistent since 2015 (Figure 3, top).
A major re-curation project, covering over 117,000 records in this repository, was done during 2025 (Habermann and Riley, 2025). Prior to that, the metadata completeness was consistently low (11%) over the entire history of the repository. The bottom frame of Figure 3 shows completeness vs. update year and the increased completeness of the records updated during 2025 is clear. The re-curation increased overall completeness (heavy purple) to ~36% as seen in the top Figure.
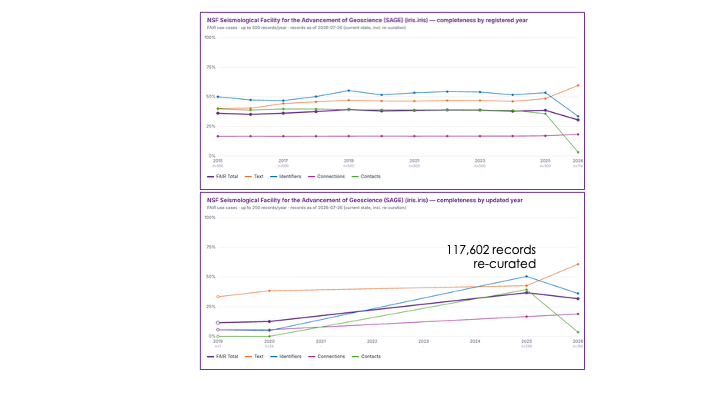
Figure 3. Yearly completeness in the SAGE repository for four FAIR use cases. The top frame shows completeness by registered year, i.e. the year the DOI is created. Note the consistency of the metadata between 2015 and 2025. The bottom frame shows the same metadata by updated year. Over 117,000 records were re-curated during 2025. Prior to that, the metadata completeness was consistently low (11%) over the entire history of the repository. Re-curation covered the entire repository prior to 2025 and increased overall completeness (heavy purple) to ~36%. View picture 1, view picture 2.
Both frames in Figure 3 show sharp changes in three use cases during 2026: increases in text (orange) and decreases in identifiers (blue) and contacts (green). Figure 4 shows quarterly completeness which details of the 2026 changes. The first two columns reflect the completeness achieved in the re-curation project (39%). The increases in the text use case (orange) reflect the addition of abstracts, temporal extent, and spatial extent to the metadata in the upper left quadrant of the plots. The resources described here are seismic networks, so this is important metadata. The decreases in identifiers are related to decreases in the author and affiliation identifiers in the lower left of the identifier radar plots (blue) radar plots while the decrease in contacts (green) reflects a lack of Rights Holder metadata.
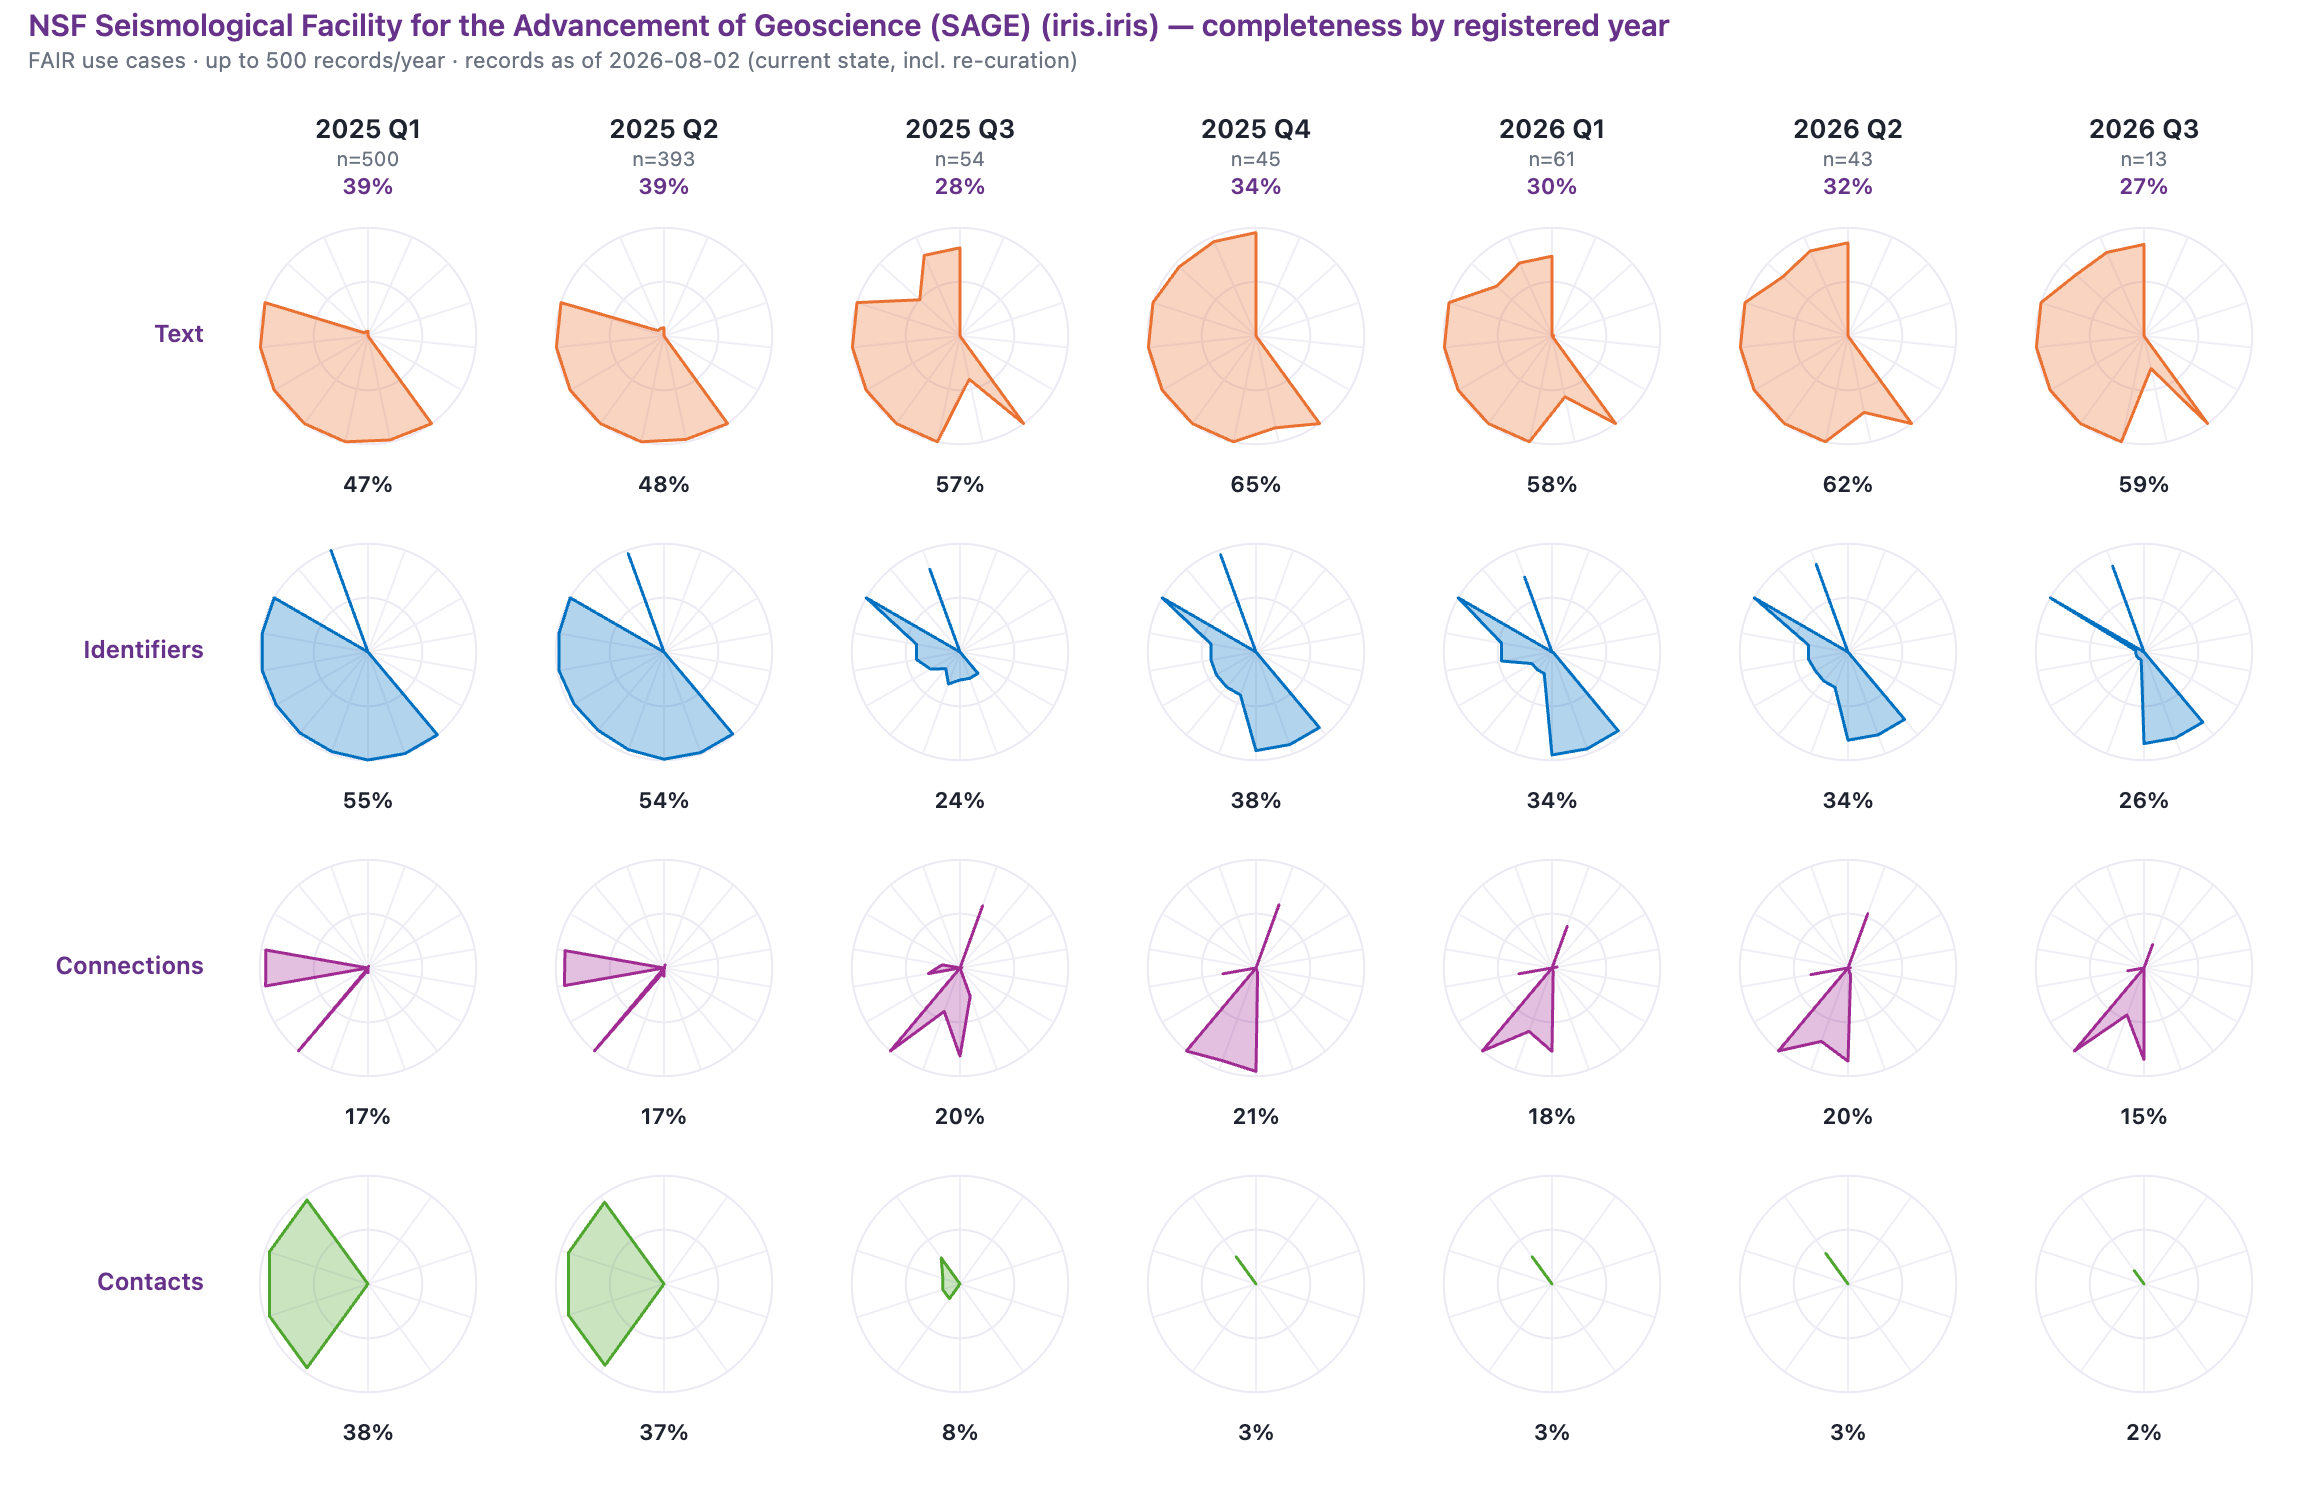
Figure 4. Quarterly completeness in the SAGE repository during 2025 and 2026 provides details of the 2026 changes. increases in the text use case (orange) and decreases in the identifier use case (blue) provide details of the changes in Figure 3. View picture (select grid view).
Axiom Data Science
Axiom Data Science is an informatics and software development company that manages data from observational datasets. Their metadata show essentially constant completeness between 2017 and 2026 (Figure 5).
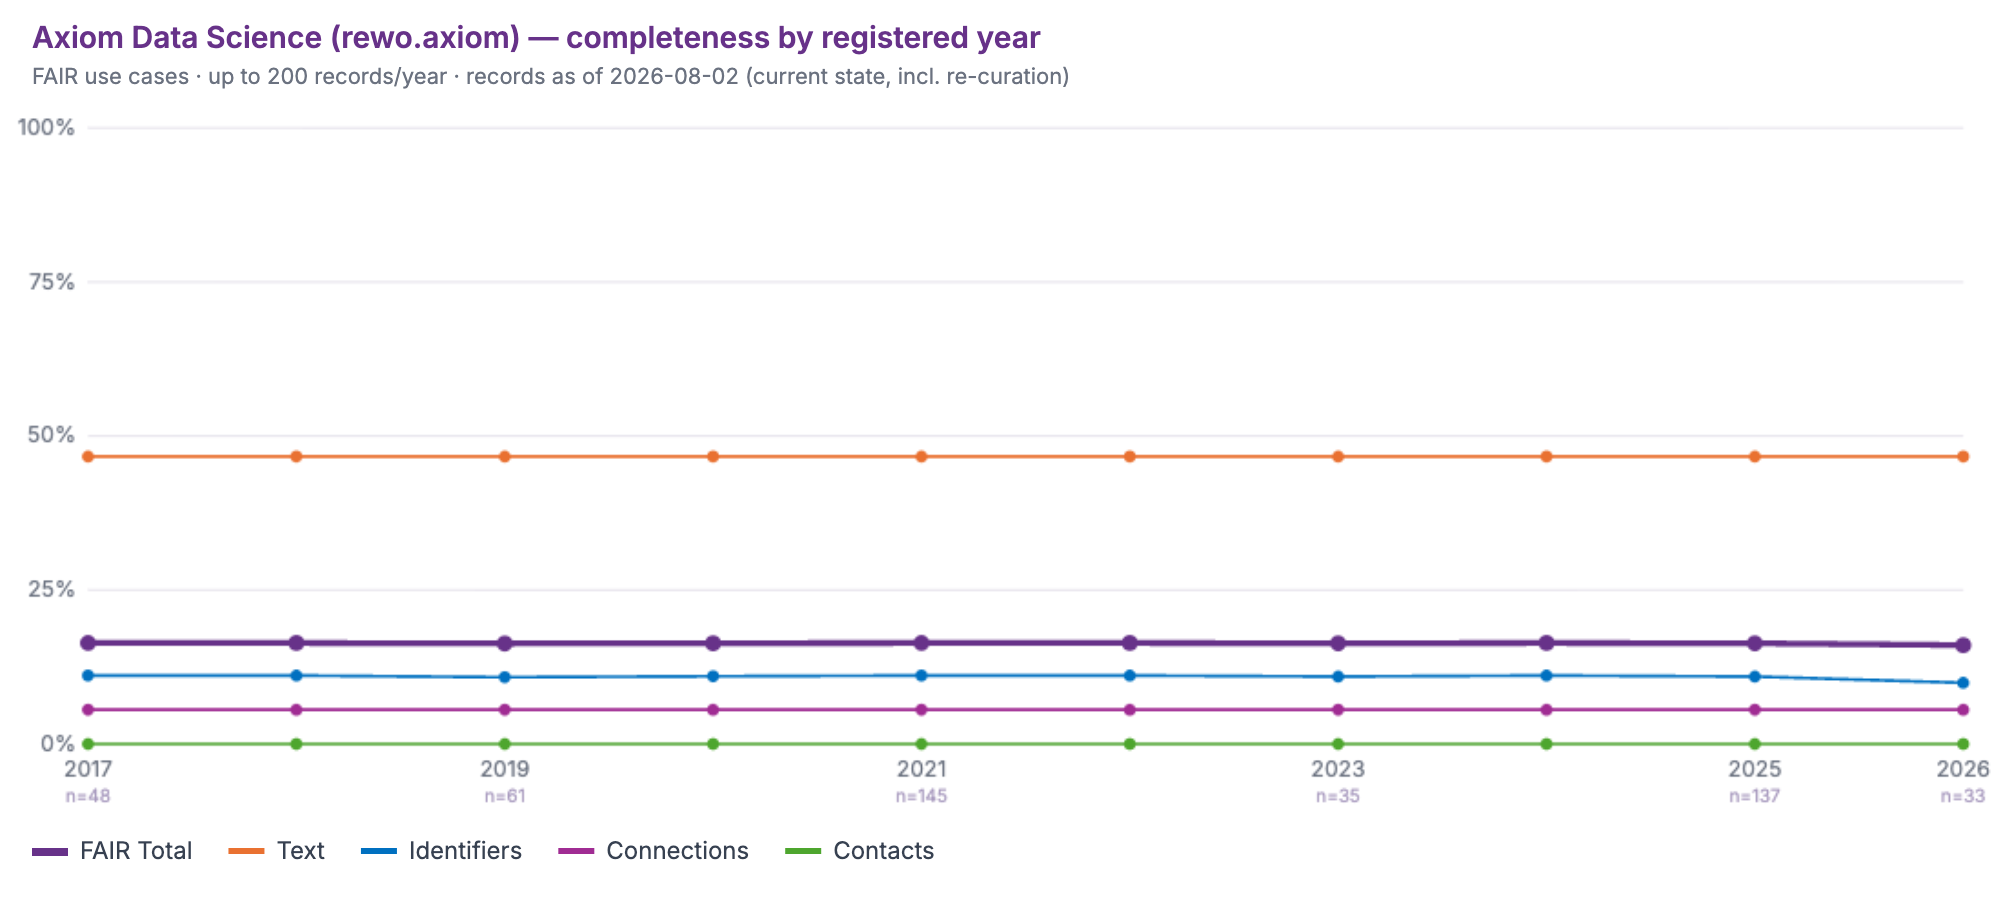
Figure 5. Yearly metadata completeness for the Axiom Data Science repository between 2017 and 2026. All four use cases show essentially constant completeness over the entire period. View picture.
Figure 6 shows metadata activity in the Axion repository between 2020 and 2026. These data were retrieved using the DataCite Activities API and include 1,248 update events across 615 DOIs.
Two kinds of activity are clear. Most quarters show registration (grey) and added URLs (blue) while those late in 2022 and between 2025 Q4 and present show updates in many metadata elements, i.e. active metadata updates. Combining these observations with the constant completeness in Figure 6 indicates that these changes are updates to existing element content.
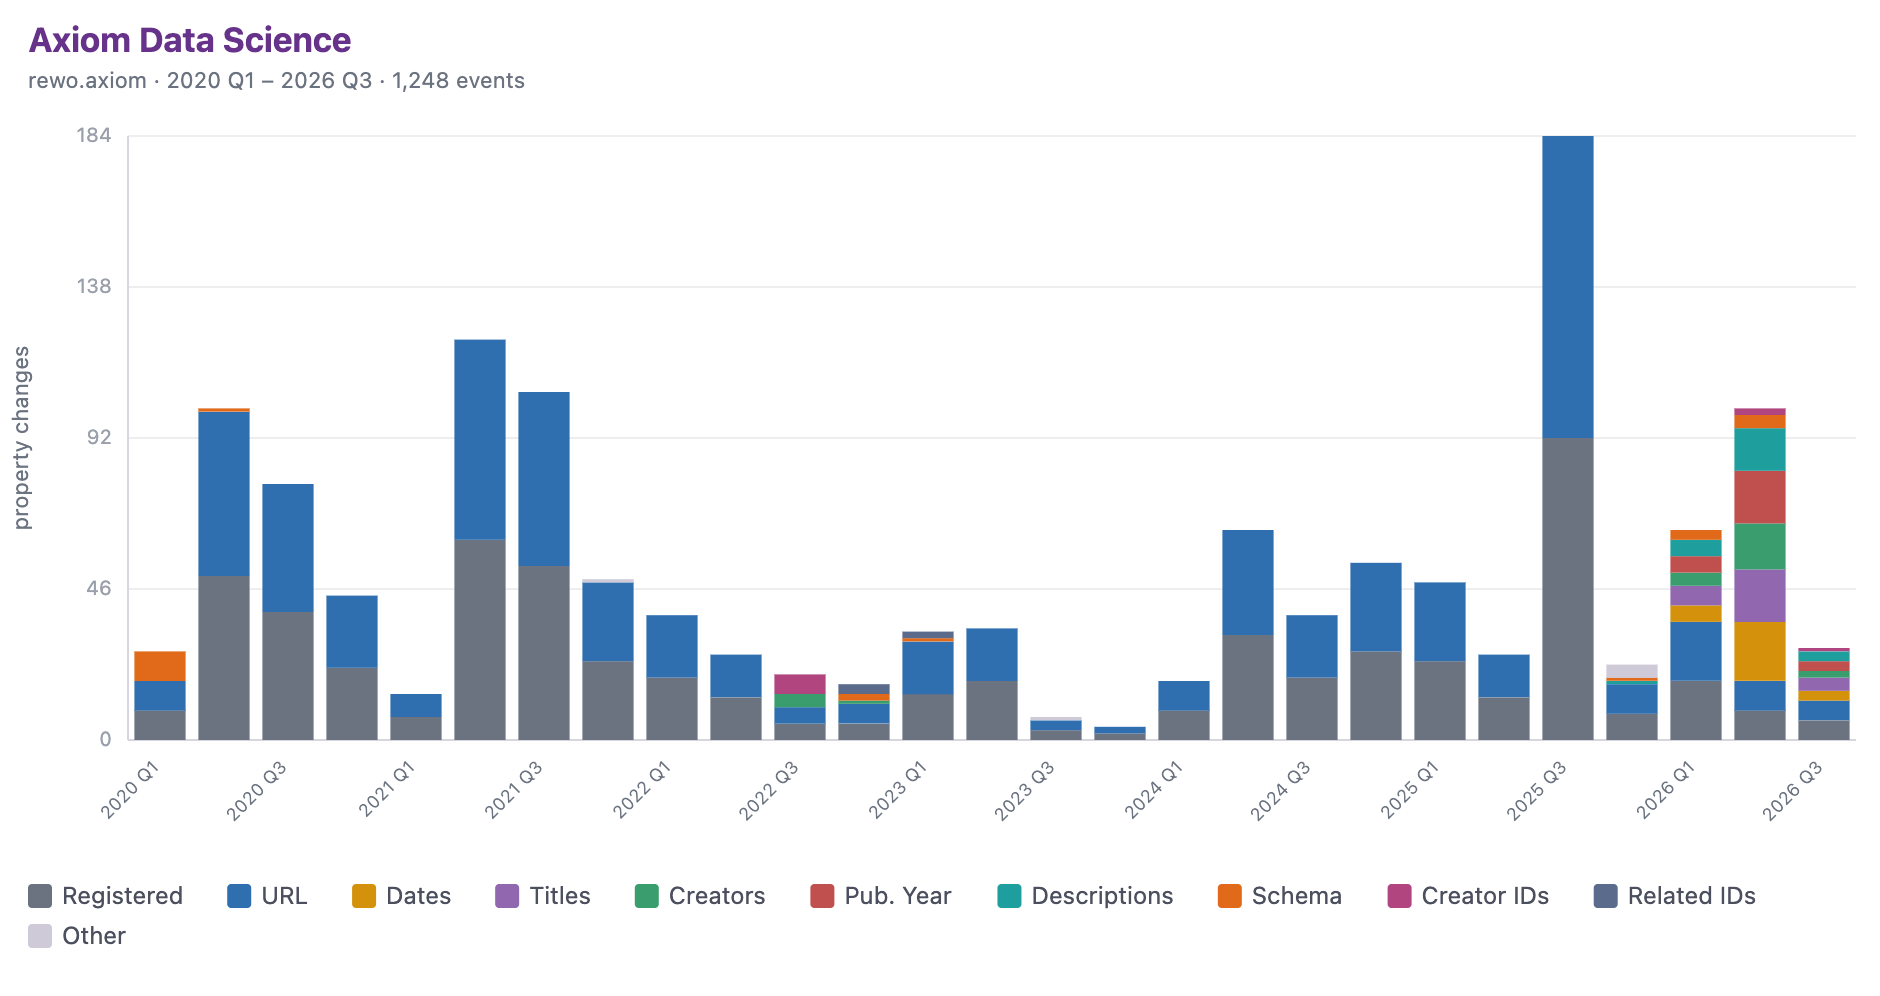
Figure 6. Quarterly metadata activity for the Axion repository between 2020 and 2026. The Y-axis is the number of property changes / quarter and the colors indicate the properties that have changed. note periods of active metadata updates during Q3 and Q4 2022 and after 2025 q4. View picture.
Discussion
DataCite repositories have a wide variety of metadata improvement behaviors and related stories that reflect development and execution of those behaviors. Each repository demonstrates a different kind of story. BCODMO demonstrates “now and forward”, the National Geophysical Facility (IRIS) demonstrates “raise all boats”, and Axiom demonstrates “current values”.
The story scrapbooks can be viewed using Metadata Game Changers Repository Tools and the URLs given in each figure caption above. You can view the scrapbook for your repository using the same tools and the Repository Guide. Helping repositories make their invisible metadata work visible is one of our goals. Be sure to share your story once you tell it.
References
Bates, J., Lin, Y.-W., and Goodale, P. (2016). Data journeys: Capturing the socio-material constitution of data objects and flows. In Big Data and Society (Vol. 3, Issue 2, p. 205395171665450). SAGE Publications. https://doi.org/10.1177/2053951716654502
Habermann, T. and Jones, J. (2025). Data Journeys Through the Global Research Infrastructure. Front Matter. https://doi.org/10.59350/1xe6n-a1x59
Habermann, T. and Riley, J. (2025). Tech Notes: Identifying EarthScope (Version 1.0). Zenodo. https://doi.org/10.5281/zenodo.17238702
Leonelli, S., & Tempini, N. (Eds.). (2020). Data Journeys in the Sciences. Springer International Publishing. https://doi.org/10.1007/978-3-030-37177-7