
A Decade of FAIR Metadata
/Ted Habermann and Erin Robinson, Metadata Game Changers
Cite this blog as: Habermann, T. and Robinson, E. (2026). A Decade of FAIR Metadata. Front Matter. https://doi.org/10.59350/dtj7x-jzt30
Introduction
It has been a decade since the publication of the FAIR Principles and Version 4 of the DataCite Metadata Schema. The schema has been revised seven (almost eight) times since that release, adding many capabilities that are critical for implementing all FAIR Principles. Of course, capabilities in metadata schema do not translate to content in metadata without hard work across the entire research landscape, starting with researchers, and librarians, and extending to repositories, publishers and users. Doing this work depends on a core belief that complete metadata are a foundation for trustworthy data and actions that reflect that belief. Many times those actions are invisible. One of our goals is to analyze metadata to make that invisible work visible.
Many communities include individuals or groups whose behaviors and strategies enable them to find better solutions to problems than their peers while having access to the same resources and facing similar or worse challenges, termed bright spots (Switch, Positive Deviance). These bright spots contribute lessons learned while demonstrating that change can actually happen, even in the tightly constrained environments that characterize our communities.
We have identified several types of bright spots in the DataCite community: repositories or universities with long-term histories of complete metadata and consortia with many member repositories with more complete metadata. Here, in celebration of the first FAIR decade, we look for repositories that have improved FAIR metadata completeness significantly during the last ten years. Some of these bright spots have been missed in previous work because their pre-improvement metadata are included in the long-term picture, dragging down their overall completeness. The approach used here, focused on improvements, finds those important targets.
Methodology
DataCite includes nearly 1,800 members with over 4,000 repositories. For this work we are looking for repositories that 1) have been active for a decade and 2) have improved FAIR completeness of their metadata at some point during that time.
We addressed the first requirement by selecting 595 repositories that had registered DOIs since 2017. Most of these (540) had ten years of metadata to work with, others missed a few years in the decade. We selected yearly subsets from these repositories for each year with DataCite API queries like
https://api.datacite.org/dois?registered=2026&client-id=dryad.dryad, which yields metadata for records registered by the Dryad repository during 2026. This resulted in 5338 metadata years of data and 4.8 million metadata records. Random samples of 5000 records / year were selected in 51 cases when repositories had more than 5000 records in a year. The median number of records / year is 118. This is termed the “Overall Dataset” below.
We determined completeness, i.e. the percent of records that include each of the 61 metadata elements in each repository metadata year and four FAIR use cases (Text, Identifiers, Connections, and Contacts) and we combined those numbers to determine “Total FAIRness”. The elements included in each use case are described in the radar plot key. We focused on total FAIR completeness to define bright spots in this dataset.
Overall Dataset
The Overall Dataset defines the big picture and addresses changes in FAIRness across all of DataCite. The goal is to find repositories where completeness has changed, i.e. where the range between the maximum and minimum values is large. Table 1 shows minima, maxima, and median ranges for each use case and the total completeness. It shows, for example, that the maximum completeness range for the Text use case is 48.54% , i.e. a repository (Materials Physics and Mechanics (spbpu.mpm)) had a difference in maximum and minimum yearly completeness of 48.54% for the Text use case between 2017 and 2026. This, and the other maxima in Table 1 show that large changes have occurred in some repositories across the DataCite community during the last decade. The maximum ranges vary between 35% and 64% with the largest range being in the Identifiers use case. At the same time, the median ranges are below 10% except for the Identifiers use case at 11.7%, indicating that, overall, changes in completeness are rather small. In fact, all of the use cases include repositories that had no change in completeness between 2017 and 2026, so the minimum ranges in all cases are zero.
Table 1. Minimum, average, maximum, and range of yearly average metadata completeness across 595 repositories and four FAIR use cases and Total between 2017 and 2026.
Figure 1. shows the distributions of ranges for the use cases and the total completeness. The diamonds and lines show the medians and the 25% and 75% quartiles. All of the use cases and the total show thin peaks of repositories with large changes and blobs of repositories with very little change, i.e. < 10%.
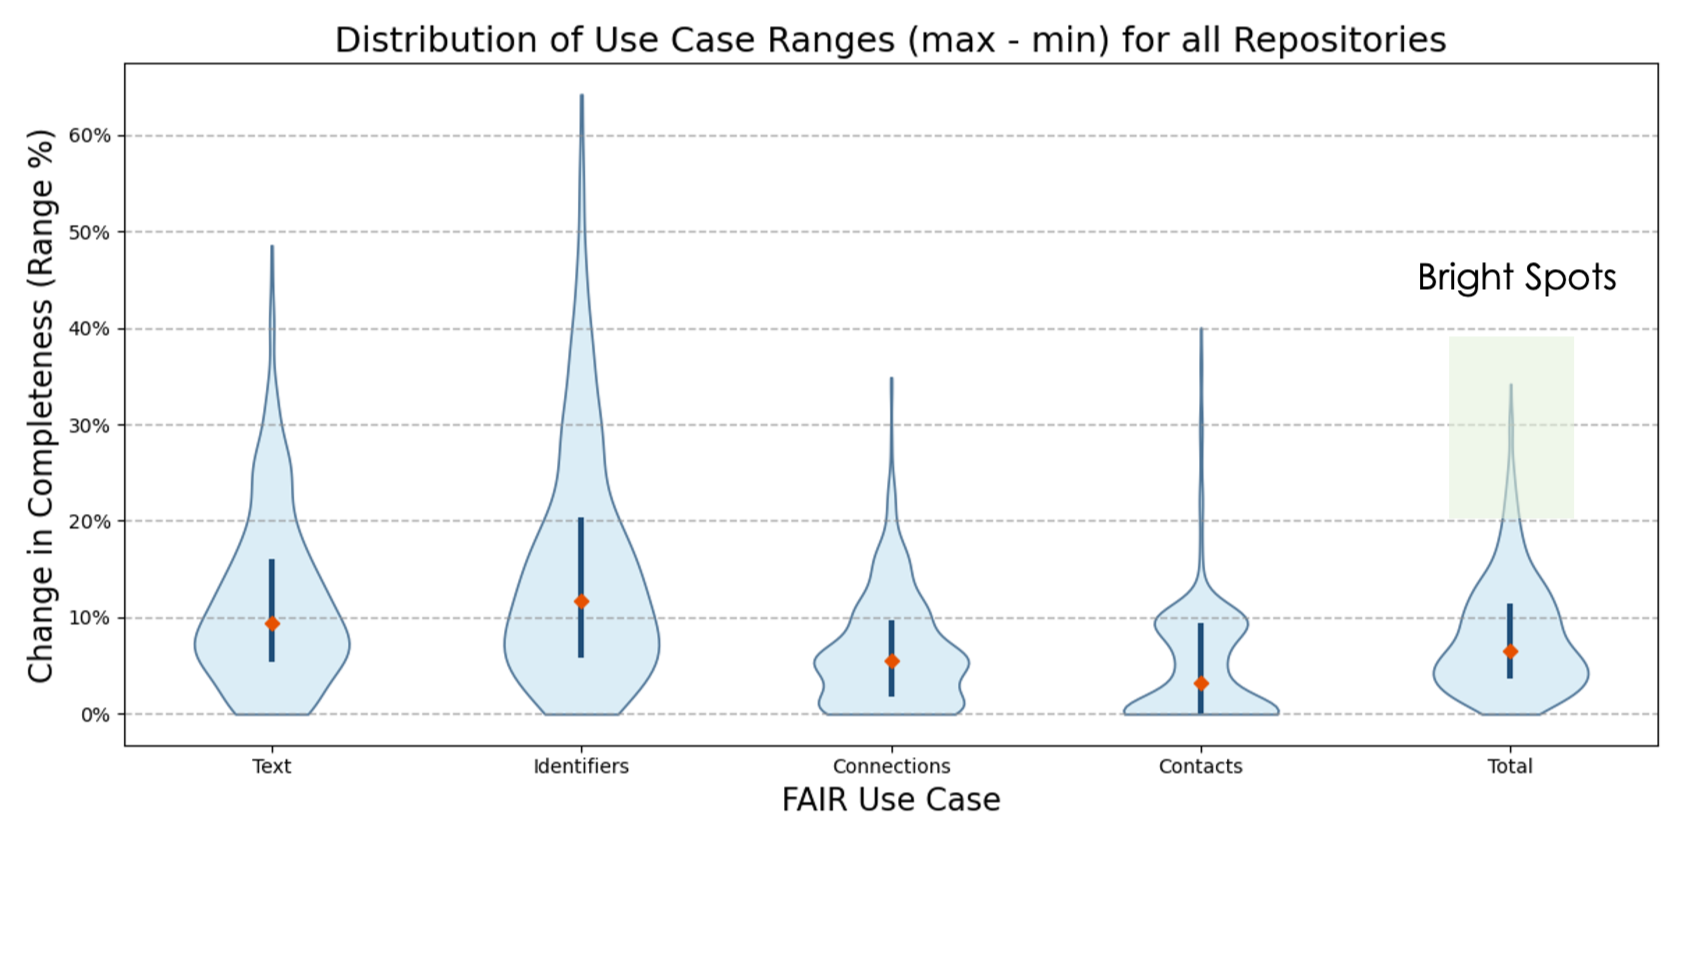
Figure 1. Violin plot of the completeness ranges across 595 repositories and four FAIR use cases and total between 2017 and 2026. The diamonds and lines show the median values and 25% and 75% quartiles for each use case.
Bright Spots
Bright spots in this context are those repositories that show the largest changes in completeness over time. Figure 1 shows that bright spots exist for all use cases, and all of these certainly have lessons we all could learn, but we focused here on total completeness. The range distributions are shown above and the overall distribution of total completeness ranges is shown in Figure 2. The most common range is .04 to .05, and the median total range is 6.7%, confirming that changes in overall FAIRness of DataCite metadata are generally small over the first FAIR decade.
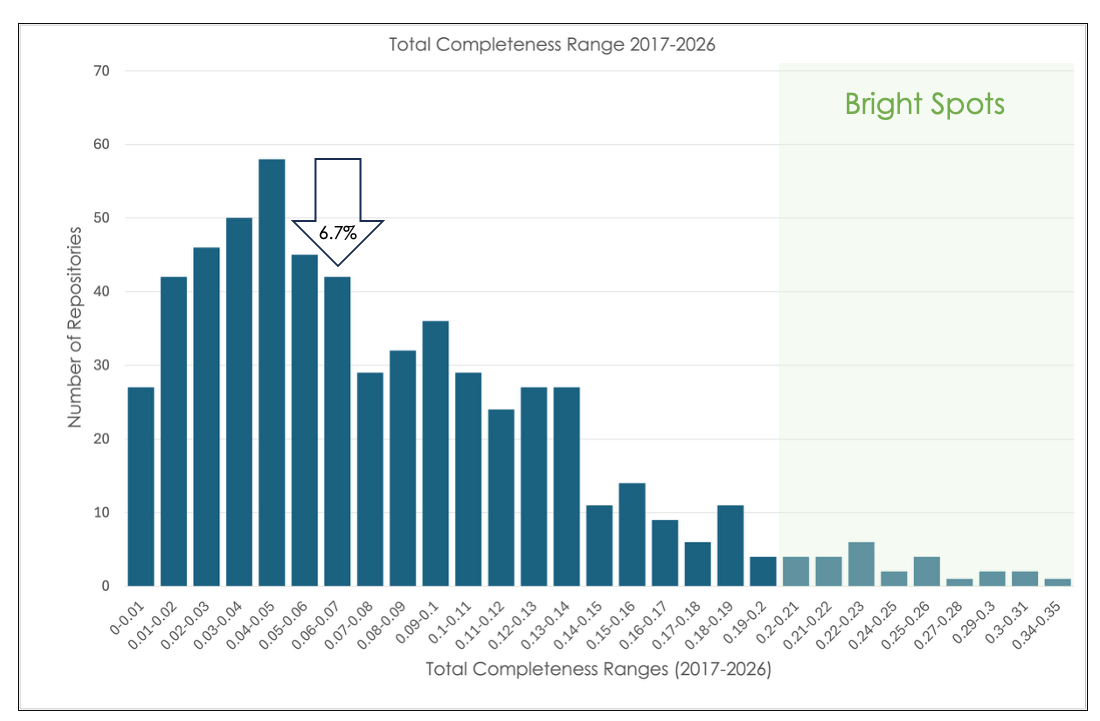
Figure 2. Distribution of total completeness ranges across all repositories. Note from Table 1 that the overall median is 6.7%. Bright spots are selected as those with ranges >= 20%, shown in the green box.
We defined bright spots as repositories with ranges of total completeness >= 20%, those in the green boxes in Figures 1 and 2. Table 2 shows these twenty-six repositories and their ranges for all use cases. The bright spots include universities, federal, generalist, and domain repositories from all over the world.
Table 2. Table 2. Ranges of use case completeness for 26 repositories between 2017 and 2026. These bright spots were selected because the range of total completeness was >= 20%.
The three repositories with the largest ranges are associated with universities. These top three repositories are generally small, i.e., several hundred or fewer records / year. and they generally show a pattern like that seen at the Purdue University Research Repository (PURR) in Figure 3. Sharp increases in completeness for all use cases occurred at PURR between 2017 and 2019 and completeness remained stable since that time, suggesting long-term stable processes. The exception to this is the big increase in identifiers during 2024. Short-term increases like this may reflect a special project focused on identifiers during 2024.
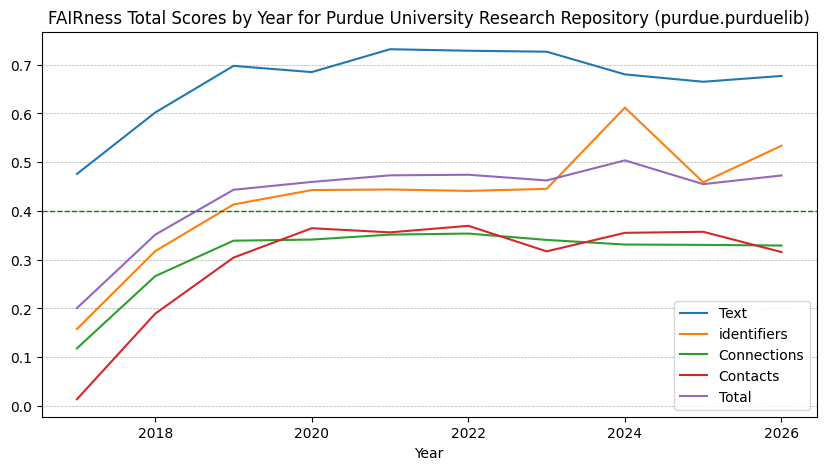
Figure 3. Yearly metadata completeness for four use cases and total for the Purdue University Research Repository. Note the increase in completeness that occurred between 2017 and 2019 and the stability since that increase.
The next highest completeness range is observed in the Dryad repository, a generalist repository publishing well over 5000 records / year. The completeness data show two kinds of change at Dryad: 1) a major refactoring of the platform during 2020 which affected three of the four use cases and the total and 2) steady improvements for most use cases since that time.
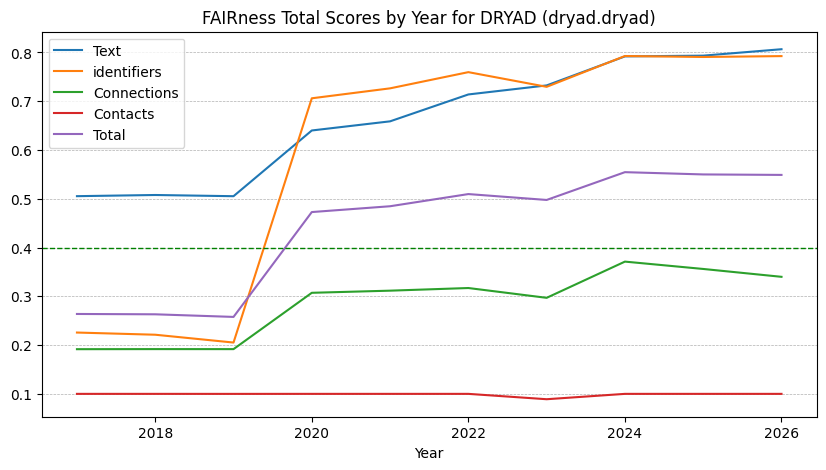
Figure 4. Yearly metadata completeness for four use cases and total for the Dryad Repository. The data reflect a major change in the repository platform during 2020 that affected three use cases and continued gradual increases in completeness since that time.
Understanding these changes in more detail requires simultaneous display of completeness for 61 metadata elements in four use cases over a decade for each repository. A grid of radar plots can accomplish this display changes in metadata completeness over time. Figure 5 shows such a plot for Dryad. Four use cases (rows) are shown for each year. As completeness increases, the radar plots fill up. Keys for the plots give the documentation concepts included in each use case.
Figure 5 shows the history grid for Dryad. Total completeness for each year is shown in parentheses in the column titles. The increase in total completeness from 26% to 47+%, shown by the purple line in Figure 4, is clear in these numbers. The first row shows completeness for the text use case, shown below the plots, as 51% between 2017 and 2019, a jump to 64% during 2020, and a gradual increase to 81% after 2021. The key for this use case indicates that the first jump is related to addition of author affiliations while the gradual increase after 2020 is spread across keywords, creation dates, and funders. The Identifiers use case in the second row of the Dryad grid clearly shows the results of a significant project that added identifiers for people and organizations to the data and addition of funder identifiers (at 4 o’clock) between 2020 and 2022. This increase in funder identifiers along with increases in technical information links at 11 o’clock in the third row contributed to the gradual increase in total completeness after 2020.
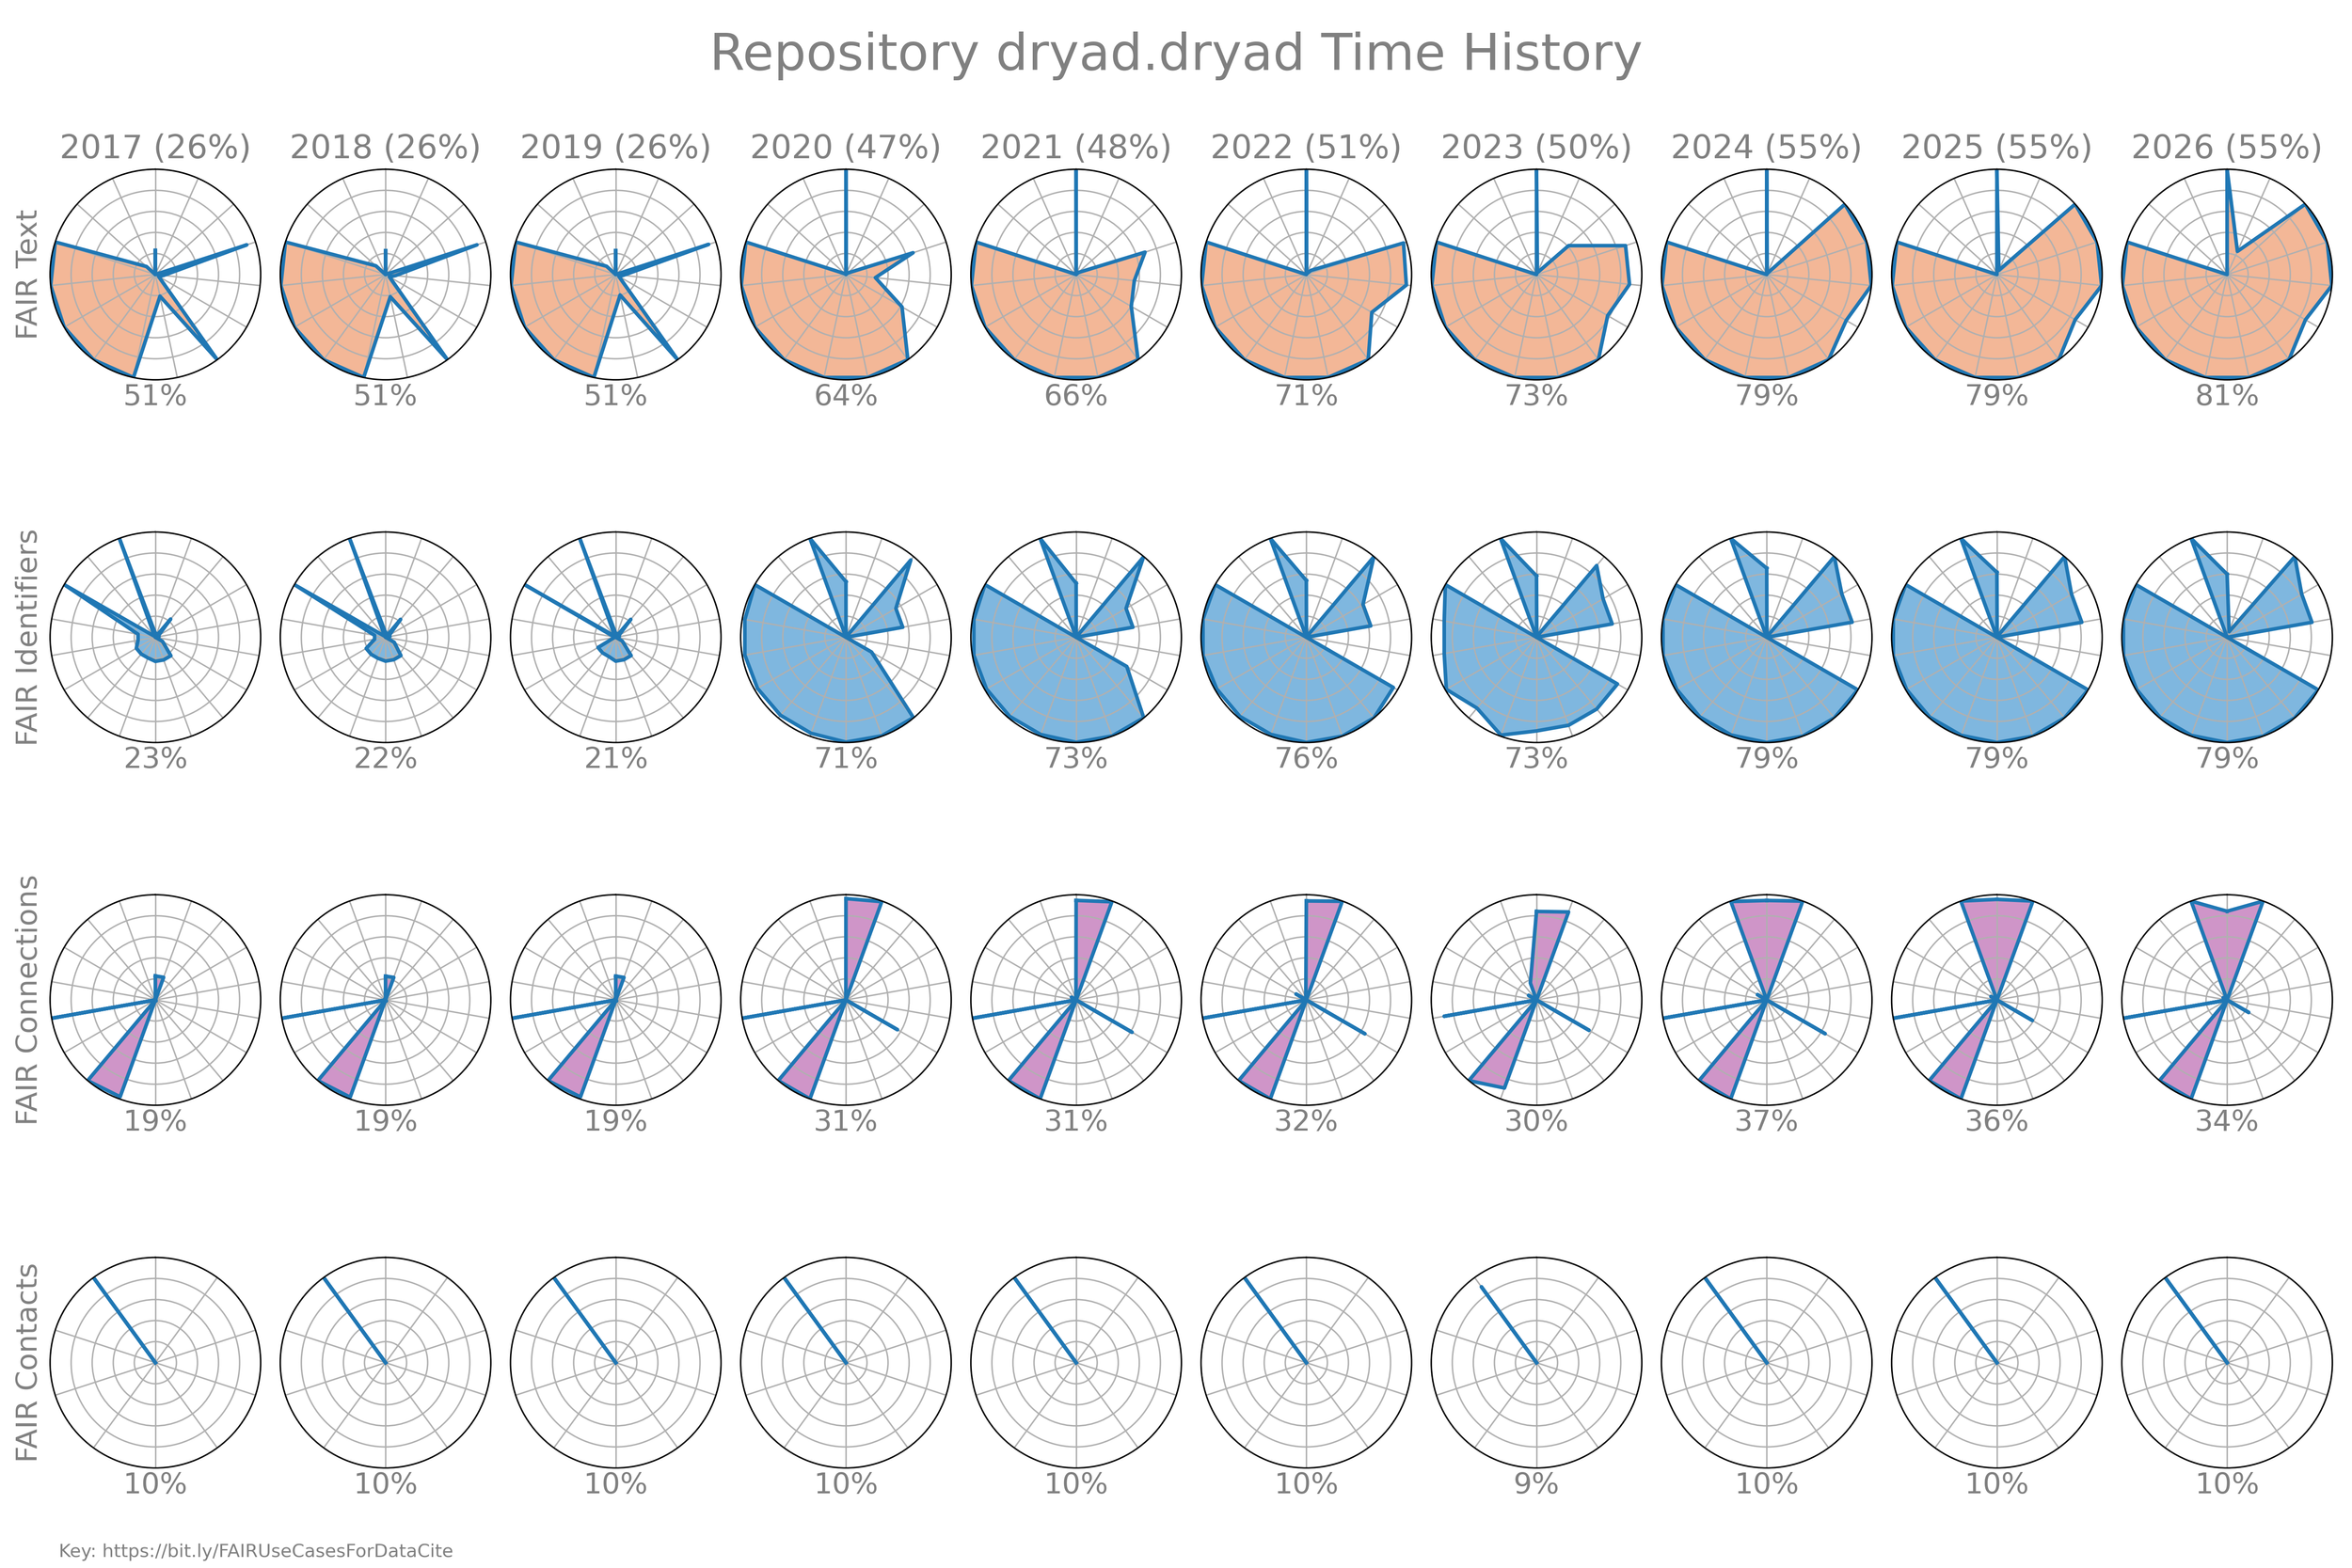
Figure 5. A radar plot grid showing completeness details for four FAIR use cases (rows) that track completeness for sixty-one metadata elements across ten years (columns). The completeness increases shown in Figure 4 appear here as sharp increases in the filled parts of the radar plots between 2019 and 2020 and more subtle increases after that. The completeness for each use case is shown below the plots and the total completeness is shown in parentheses at the top of each column. Keys that list the elements in each use case and their positions in the plots are available.
These repository “history grids” pack decade long histories of 61 metadata elements into a single picture and take some getting used to. Similar plots are available for all repositories with total ranges >= 15% in this gallery. Together they clearly demonstrate that many paths are available to FAIR metadata and that improvements can occur quickly, perhaps in focused projects, or over years of gradual increases.
Conclusion
The FAIR Principles, conceived a decade ago, are a very general set of guidelines for data and metadata management. They were conceived to be general enough to apply in many domains and settings. For example, the principles state that “Metadata are richly described with a plurality of accurate and relevant attributes”. To apply these principles to metadata, therefore, a set of documentation concepts that support Findability, Accessibility, Interoperability, and Reusability must be defined and mapped to the metadata dialect of interest. After the mapping is known, the metadata can be evaluated for FAIRness.
This process was applied to the DataCite metadata schema during 2019 and has been used since that time to evaluate all DataCite repositories for FAIRness and to identify those repositories with outstanding metadata completeness, termed bright spots.
In recognition of the tenth anniversary of the FAIR Principles, we used this approach to identify repositories that have improved the FAIRness of their DataCite metadata during the last ten years. We identified 26 repositories that have improved total completeness by more than 20% as bright spots (Table 2). These repositories have worked hard to take advantage of existing metadata schema capabilities to get beyond the traditional “citation and identification” use cases for DataCite. They realize that there is more to DataCite than “getting a DOI as quickly as possible” and act on that realization. It is worth noting that in most cases these improvements require sharing more existing metadata from internal repository systems rather than creating new metadata.
The bright spots reflect painstaking work by many people around the world. Hats off to them for providing great examples and lessons learned. Identification of bright spots and the amazing and outstanding work they do is important, but understanding the motivations and stories behind this work is even more important. These bright spots provide a foundation for finding and sharing those stories.
Tools for Your Repository
Are you interested in exploring FAIRness of metadata in your repository using these use cases? We have been working on developing freely available tools for doing just that and, in addition, exploring how metadata might support important use cases for Projects. These tools can also help find identifiers for creators, contributors, research organizations, funders and publishers in your metadata. Click the button below to try them out.